Xarray Tips and Tricks
This material is adapted from the Earth and Environmental Data Science, from Ryan Abernathey (Columbia University).
Build a multi-file dataset from an OpenDAP server
One thing we love about xarray is the open_mfdataset function, which combines many netCDF files into a single xarray Dataset.
But what if the files are stored on a remote server and accessed over OpenDAP. An example can be found in NOAA’s NCEP Reanalysis catalog.
https://www.esrl.noaa.gov/psd/thredds/catalog/Datasets/ncep.reanalysis/surface/catalog.html
The dataset is split into different files for each variable and year. For example, a single file for surface air temperature looks like:
http://www.esrl.noaa.gov/psd/thredds/dodsC/Datasets/ncep.reanalysis/surface/air.sig995.1948.nc
We can’t just call
open_mfdataset("http://www.esrl.noaa.gov/psd/thredds/dodsC/Datasets/ncep.reanalysis/surface/air.sig995.*.nc")
Because wildcard expansion doesn’t work with OpenDAP endpoints. The solution is to manually create a list of files to open.
import xarray as xr
%matplotlib inline

base_url = 'http://www.esrl.noaa.gov/psd/thredds/dodsC/Datasets/ncep.reanalysis/surface/air.sig995'

files = [f'{base_url}.{year}.nc' for year in range(2015, 2019)]
files
['http://www.esrl.noaa.gov/psd/thredds/dodsC/Datasets/ncep.reanalysis/surface/air.sig995.2015.nc',
 'http://www.esrl.noaa.gov/psd/thredds/dodsC/Datasets/ncep.reanalysis/surface/air.sig995.2016.nc',
 'http://www.esrl.noaa.gov/psd/thredds/dodsC/Datasets/ncep.reanalysis/surface/air.sig995.2017.nc',
 'http://www.esrl.noaa.gov/psd/thredds/dodsC/Datasets/ncep.reanalysis/surface/air.sig995.2018.nc']
ds = xr.open_mfdataset(files)
ds
<xarray.Dataset>
Dimensions:  (lat: 73, lon: 144, time: 5844)
Coordinates:
  * time     (time) datetime64[ns] 2015-01-01 ... 2018-12-31T18:00:00
  * lat      (lat) float32 90.0 87.5 85.0 82.5 80.0 ... -82.5 -85.0 -87.5 -90.0
  * lon      (lon) float32 0.0 2.5 5.0 7.5 10.0 ... 350.0 352.5 355.0 357.5
Data variables:
    air      (time, lat, lon) float32 dask.array<chunksize=(1460, 73, 144), meta=np.ndarray>
Attributes:
    Conventions:                     COARDS
    title:                           4x daily NMC reanalysis (2014)
    history:                         created 2013/12 by Hoop (netCDF2.3)
    description:                     Data is from NMC initialized reanalysis\...
    platform:                        Model
    dataset_title:                   NCEP-NCAR Reanalysis 1
    References:                      http://www.psl.noaa.gov/data/gridded/dat...
DODS_EXTRA.Unlimited_Dimension: time- lat: 73
- lon: 144
- time: 5844
- time(time)datetime64[ns]2015-01-01 ... 2018-12-31T18:00:00
- long_name :
- Time
- delta_t :
- 0000-00-00 06:00:00
- standard_name :
- time
- axis :
- T
array(['2015-01-01T00:00:00.000000000', '2015-01-01T06:00:00.000000000', '2015-01-01T12:00:00.000000000', ..., '2018-12-31T06:00:00.000000000', '2018-12-31T12:00:00.000000000', '2018-12-31T18:00:00.000000000'], dtype='datetime64[ns]') - lat(lat)float3290.0 87.5 85.0 ... -87.5 -90.0
- units :
- degrees_north
- actual_range :
- [ 90. -90.]
- long_name :
- Latitude
- standard_name :
- latitude
- axis :
- Y
array([ 90. , 87.5, 85. , 82.5, 80. , 77.5, 75. , 72.5, 70. , 67.5, 65. , 62.5, 60. , 57.5, 55. , 52.5, 50. , 47.5, 45. , 42.5, 40. , 37.5, 35. , 32.5, 30. , 27.5, 25. , 22.5, 20. , 17.5, 15. , 12.5, 10. , 7.5, 5. , 2.5, 0. , -2.5, -5. , -7.5, -10. , -12.5, -15. , -17.5, -20. , -22.5, -25. , -27.5, -30. , -32.5, -35. , -37.5, -40. , -42.5, -45. , -47.5, -50. , -52.5, -55. , -57.5, -60. , -62.5, -65. , -67.5, -70. , -72.5, -75. , -77.5, -80. , -82.5, -85. , -87.5, -90. ], dtype=float32) - lon(lon)float320.0 2.5 5.0 ... 352.5 355.0 357.5
- units :
- degrees_east
- long_name :
- Longitude
- actual_range :
- [ 0. 357.5]
- standard_name :
- longitude
- axis :
- X
array([  0. ,   2.5,   5. ,   7.5,  10. ,  12.5,  15. ,  17.5,  20. ,  22.5,
        25. ,  27.5,  30. ,  32.5,  35. ,  37.5,  40. ,  42.5,  45. ,  47.5,
        50. ,  52.5,  55. ,  57.5,  60. ,  62.5,  65. ,  67.5,  70. ,  72.5,
        75. ,  77.5,  80. ,  82.5,  85. ,  87.5,  90. ,  92.5,  95. ,  97.5,
       100. , 102.5, 105. , 107.5, 110. , 112.5, 115. , 117.5, 120. , 122.5,
       125. , 127.5, 130. , 132.5, 135. , 137.5, 140. , 142.5, 145. , 147.5,
       150. , 152.5, 155. , 157.5, 160. , 162.5, 165. , 167.5, 170. , 172.5,
       175. , 177.5, 180. , 182.5, 185. , 187.5, 190. , 192.5, 195. , 197.5,
       200. , 202.5, 205. , 207.5, 210. , 212.5, 215. , 217.5, 220. , 222.5,
       225. , 227.5, 230. , 232.5, 235. , 237.5, 240. , 242.5, 245. , 247.5,
       250. , 252.5, 255. , 257.5, 260. , 262.5, 265. , 267.5, 270. , 272.5,
       275. , 277.5, 280. , 282.5, 285. , 287.5, 290. , 292.5, 295. , 297.5,
       300. , 302.5, 305. , 307.5, 310. , 312.5, 315. , 317.5, 320. , 322.5,
       325. , 327.5, 330. , 332.5, 335. , 337.5, 340. , 342.5, 345. , 347.5,
       350. , 352.5, 355. , 357.5], dtype=float32)
- air(time, lat, lon)float32dask.array<chunksize=(1460, 73, 144), meta=np.ndarray>
- long_name :
- 4xDaily Air temperature at sigma level 995
- units :
- degK
- precision :
- 2
- GRIB_id :
- 11
- GRIB_name :
- TMP
- var_desc :
- Air temperature
- level_desc :
- Surface
- statistic :
- Individual Obs
- parent_stat :
- Other
- valid_range :
- [185.16 331.16]
- dataset :
- NCEP Reanalysis
- actual_range :
- [185.8 322.4]
- _ChunkSizes :
- [ 1 73 144]
Array Chunk Bytes 245.73 MB 61.56 MB Shape (5844, 73, 144) (1464, 73, 144) Count 12 Tasks 4 Chunks Type float32 numpy.ndarray
- Conventions :
- COARDS
- title :
- 4x daily NMC reanalysis (2014)
- history :
- created 2013/12 by Hoop (netCDF2.3)
- description :
- Data is from NMC initialized reanalysis (4x/day). These are the 0.9950 sigma level values.
- platform :
- Model
- dataset_title :
- NCEP-NCAR Reanalysis 1
- References :
- http://www.psl.noaa.gov/data/gridded/data.ncep.reanalysis.html
- DODS_EXTRA.Unlimited_Dimension :
- time
We have now opened the entire ensemble of files on the remote server as a single xarray Dataset!
Perform Correlation Analysis
def covariance(x, y, dims=None):
    return xr.dot(x - x.mean(dims), y - y.mean(dims), dims=dims) / x.count(dims)

def corrrelation(x, y, dims=None):
    return covariance(x, y, dims) / (x.std(dims) * y.std(dims))
import xarray as xr
url = 'http://www.esrl.noaa.gov/psd/thredds/dodsC/Datasets/noaa.ersst.v5/sst.mnmean.nc'
ds = xr.open_dataset(url)
ds = ds.sel(time=slice('1960', '2018')).load()
ds
<xarray.Dataset>
Dimensions:    (lat: 89, lon: 180, nbnds: 2, time: 708)
Coordinates:
  * lat        (lat) float32 88.0 86.0 84.0 82.0 ... -82.0 -84.0 -86.0 -88.0
  * lon        (lon) float32 0.0 2.0 4.0 6.0 8.0 ... 352.0 354.0 356.0 358.0
  * time       (time) datetime64[ns] 1960-01-01 1960-02-01 ... 2018-12-01
Dimensions without coordinates: nbnds
Data variables:
    time_bnds  (time, nbnds) float64 9.969e+36 9.969e+36 ... 9.969e+36 9.969e+36
    sst        (time, lat, lon) float32 -1.8 -1.8 -1.8 -1.8 ... nan nan nan nan
Attributes: (12/38)
    climatology:                     Climatology is based on 1971-2000 SST, X...
    description:                     In situ data: ICOADS2.5 before 2007 and ...
    keywords_vocabulary:             NASA Global Change Master Directory (GCM...
    keywords:                        Earth Science > Oceans > Ocean Temperatu...
    instrument:                      Conventional thermometers
    source_comment:                  SSTs were observed by conventional therm...
    ...                              ...
    license:                         No constraints on data access or use
    comment:                         SSTs were observed by conventional therm...
    summary:                         ERSST.v5 is developed based on v4 after ...
    dataset_title:                   NOAA Extended Reconstructed SST V5
    data_modified:                   2021-03-07
DODS_EXTRA.Unlimited_Dimension: time- lat: 89
- lon: 180
- nbnds: 2
- time: 708
- lat(lat)float3288.0 86.0 84.0 ... -86.0 -88.0
- units :
- degrees_north
- long_name :
- Latitude
- actual_range :
- [ 88. -88.]
- standard_name :
- latitude
- axis :
- Y
- coordinate_defines :
- center
array([ 88., 86., 84., 82., 80., 78., 76., 74., 72., 70., 68., 66., 64., 62., 60., 58., 56., 54., 52., 50., 48., 46., 44., 42., 40., 38., 36., 34., 32., 30., 28., 26., 24., 22., 20., 18., 16., 14., 12., 10., 8., 6., 4., 2., 0., -2., -4., -6., -8., -10., -12., -14., -16., -18., -20., -22., -24., -26., -28., -30., -32., -34., -36., -38., -40., -42., -44., -46., -48., -50., -52., -54., -56., -58., -60., -62., -64., -66., -68., -70., -72., -74., -76., -78., -80., -82., -84., -86., -88.], dtype=float32) - lon(lon)float320.0 2.0 4.0 ... 354.0 356.0 358.0
- units :
- degrees_east
- long_name :
- Longitude
- actual_range :
- [ 0. 358.]
- standard_name :
- longitude
- axis :
- X
- coordinate_defines :
- center
array([ 0., 2., 4., 6., 8., 10., 12., 14., 16., 18., 20., 22., 24., 26., 28., 30., 32., 34., 36., 38., 40., 42., 44., 46., 48., 50., 52., 54., 56., 58., 60., 62., 64., 66., 68., 70., 72., 74., 76., 78., 80., 82., 84., 86., 88., 90., 92., 94., 96., 98., 100., 102., 104., 106., 108., 110., 112., 114., 116., 118., 120., 122., 124., 126., 128., 130., 132., 134., 136., 138., 140., 142., 144., 146., 148., 150., 152., 154., 156., 158., 160., 162., 164., 166., 168., 170., 172., 174., 176., 178., 180., 182., 184., 186., 188., 190., 192., 194., 196., 198., 200., 202., 204., 206., 208., 210., 212., 214., 216., 218., 220., 222., 224., 226., 228., 230., 232., 234., 236., 238., 240., 242., 244., 246., 248., 250., 252., 254., 256., 258., 260., 262., 264., 266., 268., 270., 272., 274., 276., 278., 280., 282., 284., 286., 288., 290., 292., 294., 296., 298., 300., 302., 304., 306., 308., 310., 312., 314., 316., 318., 320., 322., 324., 326., 328., 330., 332., 334., 336., 338., 340., 342., 344., 346., 348., 350., 352., 354., 356., 358.], dtype=float32) - time(time)datetime64[ns]1960-01-01 ... 2018-12-01
- long_name :
- Time
- delta_t :
- 0000-01-00 00:00:00
- avg_period :
- 0000-01-00 00:00:00
- prev_avg_period :
- 0000-00-07 00:00:00
- standard_name :
- time
- axis :
- T
- actual_range :
- [19723. 80750.]
- _ChunkSizes :
- 1
array(['1960-01-01T00:00:00.000000000', '1960-02-01T00:00:00.000000000',
       '1960-03-01T00:00:00.000000000', ..., '2018-10-01T00:00:00.000000000',
       '2018-11-01T00:00:00.000000000', '2018-12-01T00:00:00.000000000'],
      dtype='datetime64[ns]')
- time_bnds(time, nbnds)float649.969e+36 9.969e+36 ... 9.969e+36
- long_name :
- Time Boundaries
- _ChunkSizes :
- [1 2]
array([[9.96920997e+36, 9.96920997e+36], [9.96920997e+36, 9.96920997e+36], [9.96920997e+36, 9.96920997e+36], ..., [9.96920997e+36, 9.96920997e+36], [9.96920997e+36, 9.96920997e+36], [9.96920997e+36, 9.96920997e+36]]) - sst(time, lat, lon)float32-1.8 -1.8 -1.8 -1.8 ... nan nan nan
- long_name :
- Monthly Means of Sea Surface Temperature
- units :
- degC
- var_desc :
- Sea Surface Temperature
- level_desc :
- Surface
- statistic :
- Mean
- dataset :
- NOAA Extended Reconstructed SST V5
- parent_stat :
- Individual Values
- actual_range :
- [-1.8 42.32636]
- valid_range :
- [-1.8 45. ]
- _ChunkSizes :
- [ 1 89 180]
array([[[-1.8, -1.8, -1.8, ..., -1.8, -1.8, -1.8],
        [-1.8, -1.8, -1.8, ..., -1.8, -1.8, -1.8],
        [-1.8, -1.8, -1.8, ..., -1.8, -1.8, -1.8],
        ...,
        [ nan,  nan,  nan, ...,  nan,  nan,  nan],
        [ nan,  nan,  nan, ...,  nan,  nan,  nan],
        [ nan,  nan,  nan, ...,  nan,  nan,  nan]],

       [[-1.8, -1.8, -1.8, ..., -1.8, -1.8, -1.8],
        [-1.8, -1.8, -1.8, ..., -1.8, -1.8, -1.8],
        [-1.8, -1.8, -1.8, ..., -1.8, -1.8, -1.8],
        ...,
...
        ...,
        [ nan,  nan,  nan, ...,  nan,  nan,  nan],
        [ nan,  nan,  nan, ...,  nan,  nan,  nan],
        [ nan,  nan,  nan, ...,  nan,  nan,  nan]],

       [[-1.8, -1.8, -1.8, ..., -1.8, -1.8, -1.8],
        [-1.8, -1.8, -1.8, ..., -1.8, -1.8, -1.8],
        [-1.8, -1.8, -1.8, ..., -1.8, -1.8, -1.8],
        ...,
        [ nan,  nan,  nan, ...,  nan,  nan,  nan],
        [ nan,  nan,  nan, ...,  nan,  nan,  nan],
        [ nan,  nan,  nan, ...,  nan,  nan,  nan]]], dtype=float32)
- climatology :
- Climatology is based on 1971-2000 SST, Xue, Y., T. M. Smith, and R. W. Reynolds, 2003: Interdecadal changes of 30-yr SST normals during 1871.2000. Journal of Climate, 16, 1601-1612.
- description :
- In situ data: ICOADS2.5 before 2007 and NCEP in situ data from 2008 to present. Ice data: HadISST ice before 2010 and NCEP ice after 2010.
- keywords_vocabulary :
- NASA Global Change Master Directory (GCMD) Science Keywords
- keywords :
- Earth Science > Oceans > Ocean Temperature > Sea Surface Temperature >
- instrument :
- Conventional thermometers
- source_comment :
- SSTs were observed by conventional thermometers in Buckets (insulated or un-insulated canvas and wooded buckets) or Engine Room Intaker
- geospatial_lon_min :
- -1.0
- geospatial_lon_max :
- 359.0
- geospatial_laty_max :
- 89.0
- geospatial_laty_min :
- -89.0
- geospatial_lat_max :
- 89.0
- geospatial_lat_min :
- -89.0
- geospatial_lat_units :
- degrees_north
- geospatial_lon_units :
- degrees_east
- cdm_data_type :
- Grid
- project :
- NOAA Extended Reconstructed Sea Surface Temperature (ERSST)
- original_publisher_url :
- http://www.ncdc.noaa.gov
- References :
- https://www.ncdc.noaa.gov/data-access/marineocean-data/extended-reconstructed-sea-surface-temperature-ersst-v5 at NCEI and http://www.esrl.noaa.gov/psd/data/gridded/data.noaa.ersst.v5.html
- source :
- In situ data: ICOADS R3.0 before 2015, NCEP in situ GTS from 2016 to present, and Argo SST from 1999 to present. Ice data: HadISST2 ice before 2015, and NCEP ice after 2015
- title :
- NOAA ERSSTv5 (in situ only)
- history :
- created 07/2017 by PSD data using NCEI's ERSST V5 NetCDF values
- institution :
- This version written at NOAA/ESRL PSD: obtained from NOAA/NESDIS/National Centers for Environmental Information and time aggregated. Original Full Source: NOAA/NESDIS/NCEI/CCOG
- citation :
- Huang et al, 2017: Extended Reconstructed Sea Surface Temperatures Version 5 (ERSSTv5): Upgrades, Validations, and Intercomparisons. Journal of Climate, https://doi.org/10.1175/JCLI-D-16-0836.1
- platform :
- Ship and Buoy SSTs from ICOADS R3.0 and NCEP GTS
- standard_name_vocabulary :
- CF Standard Name Table (v40, 25 January 2017)
- processing_level :
- NOAA Level 4
- Conventions :
- CF-1.6, ACDD-1.3
- metadata_link :
- :metadata_link = https://doi.org/10.7289/V5T72FNM (original format)
- creator_name :
- Boyin Huang (original)
- date_created :
- 2017-06-30T12:18:00Z (original)
- product_version :
- Version 5
- creator_url_original :
- https://www.ncei.noaa.gov
- license :
- No constraints on data access or use
- comment :
- SSTs were observed by conventional thermometers in Buckets (insulated or un-insulated canvas and wooded buckets), Engine Room Intakers, or floats and drifters
- summary :
- ERSST.v5 is developed based on v4 after revisions of 8 parameters using updated data sets and advanced knowledge of ERSST analysis
- dataset_title :
- NOAA Extended Reconstructed SST V5
- data_modified :
- 2021-03-07
- DODS_EXTRA.Unlimited_Dimension :
- time
sst = ds.sst
sst_clim = sst.groupby('time.month').mean(dim='time')
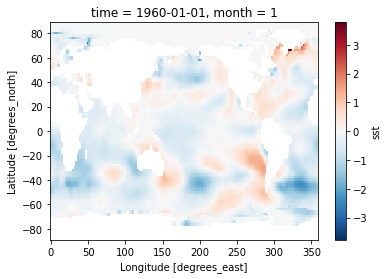
sst_anom = sst.groupby('time.month') - sst_clim
%matplotlib inline
sst_anom[0].plot()
<matplotlib.collections.QuadMesh at 0x7f0d123b08e0>
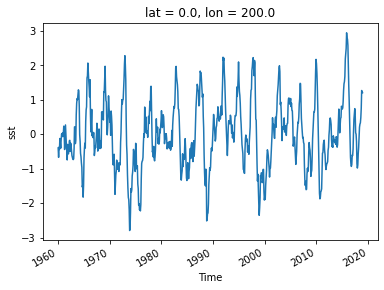
sst_ref = sst_anom.sel(lon=200, lat=0, method='nearest')
sst_ref.plot()
[<matplotlib.lines.Line2D at 0x7f0d122d3e20>]
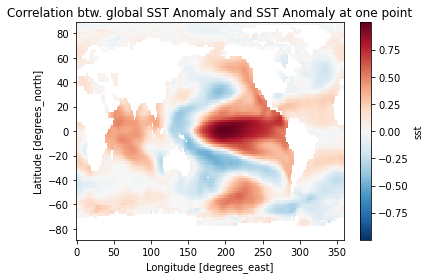
sst_cor = corrrelation(sst_anom, sst_ref, dims='time')
pc = sst_cor.plot()
pc.axes.set_title('Correlation btw. global SST Anomaly and SST Anomaly at one point')
/usr/share/miniconda/envs/envireef/lib/python3.8/site-packages/numpy/lib/nanfunctions.py:1664: RuntimeWarning: Degrees of freedom <= 0 for slice.
  var = nanvar(a, axis=axis, dtype=dtype, out=out, ddof=ddof,
Text(0.5, 1.0, 'Correlation btw. global SST Anomaly and SST Anomaly at one point')