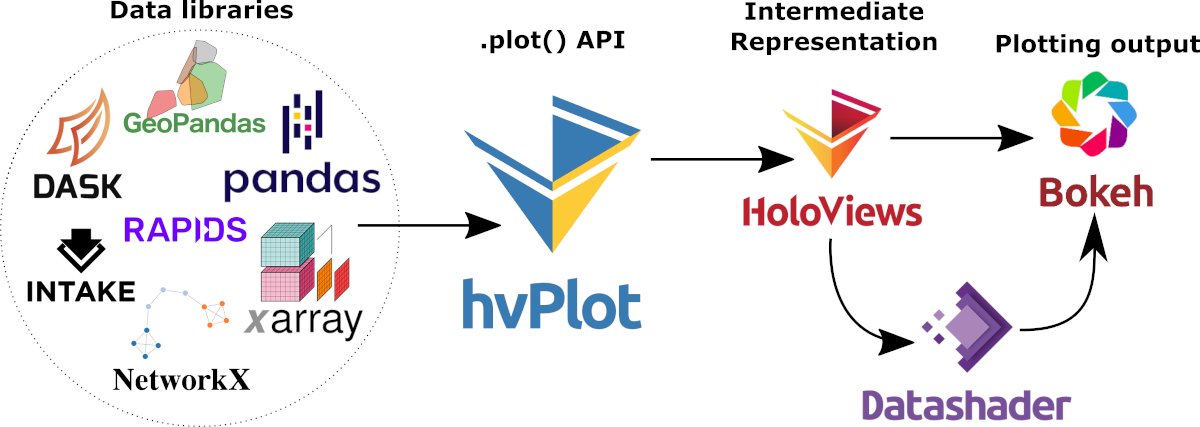
PyViz Application
In this notebook, we will create a Dashboard with two HoloViews objects:
a
panelpn.widgets.Selectobject that contains a list ofXarrayvariables, anda
hvPlotobject that takes the selected variable on input.
See also
An in-depth description of the approach quickly presented here is well discussed in a recent paper by Signell & Pothina (2019)1.
Load the required Python libraries
First of all, load the necessary libraries. These are the ones we discussed previously:
numpy
matplotlib
cartopy
panel
xarray
holoviews
geoviews
import os
import numpy as np
import xarray as xr
import cartopy
import cartopy.crs as ccrs
import cartopy.feature as cfeature
from cartopy.mpl.gridliner import LONGITUDE_FORMATTER, LATITUDE_FORMATTER
cartopy.config['data_dir'] = os.getenv('CARTOPY_DIR', cartopy.config.get('data_dir'))
import cmocean
import holoviews as hv
from holoviews import opts, dim
import geoviews as gv
from geoviews import tile_sources as gvts
import geoviews.feature as gf
from cartopy import crs as ccrs
import hvplot.xarray
import panel as pn
import warnings
warnings.filterwarnings("ignore", category=RuntimeWarning)
gv.extension('bokeh')


Build a multi-file dataset
We will use the open_mfdataset function from xArray to open multiple netCDF files into a single xarray Dataset.
We will query load the GBR4km dataset from the AIMS server, so let’s first define the base URL:
base_url = "http://thredds.ereefs.aims.gov.au/thredds/dodsC/s3://aims-ereefs-public-prod/derived/ncaggregate/ereefs/GBR4_H2p0_B3p1_Cq3b_Dhnd/daily-monthly/EREEFS_AIMS-CSIRO_GBR4_H2p0_B3p1_Cq3b_Dhnd_bgc_daily-monthly-"
For the sake of the demonstration, we will only use 1 month:
month_st = 1 # Starting month
month_ed = 1 # Ending month
year = 2018 # Year
biofiles = [f"{base_url}{year}-{month:02}.nc" for month in range(month_st, month_ed+1)]
biofiles
['http://thredds.ereefs.aims.gov.au/thredds/dodsC/s3://aims-ereefs-public-prod/derived/ncaggregate/ereefs/GBR4_H2p0_B3p1_Cq3b_Dhnd/daily-monthly/EREEFS_AIMS-CSIRO_GBR4_H2p0_B3p1_Cq3b_Dhnd_bgc_daily-monthly-2018-01.nc']
Loading the dataset into xArray
Using xArray, we open these files into a Dataset:
ds_bio = xr.open_mfdataset(biofiles)
ds_bio
<xarray.Dataset>
Dimensions: (k: 17, latitude: 723, longitude: 491, time: 31)
Coordinates:
zc (k) float64 dask.array<chunksize=(17,), meta=np.ndarray>
* time (time) datetime64[ns] 2018-01-01T02:00:00 ... 2018-01-31...
* latitude (latitude) float64 -28.7 -28.67 -28.64 ... -7.066 -7.036
* longitude (longitude) float64 142.2 142.2 142.2 ... 156.8 156.8 156.9
Dimensions without coordinates: k
Data variables: (12/101)
alk (time, k, latitude, longitude) float32 dask.array<chunksize=(31, 17, 723, 491), meta=np.ndarray>
BOD (time, k, latitude, longitude) float32 dask.array<chunksize=(31, 17, 723, 491), meta=np.ndarray>
Chl_a_sum (time, k, latitude, longitude) float32 dask.array<chunksize=(31, 17, 723, 491), meta=np.ndarray>
CO32 (time, k, latitude, longitude) float32 dask.array<chunksize=(31, 17, 723, 491), meta=np.ndarray>
DIC (time, k, latitude, longitude) float32 dask.array<chunksize=(31, 17, 723, 491), meta=np.ndarray>
DIN (time, k, latitude, longitude) float32 dask.array<chunksize=(31, 17, 723, 491), meta=np.ndarray>
... ...
SGH_N (time, latitude, longitude) float32 dask.array<chunksize=(31, 723, 491), meta=np.ndarray>
SGH_N_pr (time, latitude, longitude) float32 dask.array<chunksize=(31, 723, 491), meta=np.ndarray>
SGHROOT_N (time, latitude, longitude) float32 dask.array<chunksize=(31, 723, 491), meta=np.ndarray>
SGROOT_N (time, latitude, longitude) float32 dask.array<chunksize=(31, 723, 491), meta=np.ndarray>
TSSM (time, latitude, longitude) float32 dask.array<chunksize=(31, 723, 491), meta=np.ndarray>
Zenith2D (time, latitude, longitude) float32 dask.array<chunksize=(31, 723, 491), meta=np.ndarray>
Attributes: (12/20)
Conventions: CF-1.0
NCO: netCDF Operators version 4.7.7 (Homepage...
RunID: 2
_CoordSysBuilder: ucar.nc2.dataset.conv.CF1Convention
aims_ncaggregate_buildDate: 2020-08-21T23:07:30+10:00
aims_ncaggregate_datasetId: products__ncaggregate__ereefs__GBR4_H2p0...
... ...
paramfile: /home/bai155/EMS_solar2/gbr4_H2p0_B3p1_C...
paramhead: eReefs 4 km grid. SOURCE Catchments with...
technical_guide_link: https://eatlas.org.au/pydio/public/aims-...
technical_guide_publish_date: 2020-08-18
title: eReefs AIMS-CSIRO GBR4 BioGeoChemical 3....
DODS_EXTRA.Unlimited_Dimension: time- k: 17
- latitude: 723
- longitude: 491
- time: 31
- zc(k)float64dask.array<chunksize=(17,), meta=np.ndarray>
- long_name :
- Z coordinate
- _CoordinateAxisType :
- Height
- _CoordinateZisPositive :
- up
- units :
- m
- positive :
- up
- axis :
- Z
- coordinate_type :
- Z
Array Chunk Bytes 136 B 136 B Shape (17,) (17,) Count 2 Tasks 1 Chunks Type float64 numpy.ndarray - time(time)datetime64[ns]2018-01-01T02:00:00 ... 2018-01-...
- long_name :
- Time
- standard_name :
- time
- coordinate_type :
- time
- _CoordinateAxisType :
- Time
- _ChunkSizes :
- 1024
array(['2018-01-01T02:00:00.000000000', '2018-01-02T02:00:00.000000000', '2018-01-03T02:00:00.000000000', '2018-01-04T02:00:00.000000000', '2018-01-05T02:00:00.000000000', '2018-01-06T02:00:00.000000000', '2018-01-07T02:00:00.000000000', '2018-01-08T02:00:00.000000000', '2018-01-09T02:00:00.000000000', '2018-01-10T02:00:00.000000000', '2018-01-11T02:00:00.000000000', '2018-01-12T02:00:00.000000000', '2018-01-13T02:00:00.000000000', '2018-01-14T02:00:00.000000000', '2018-01-15T02:00:00.000000000', '2018-01-16T02:00:00.000000000', '2018-01-17T02:00:00.000000000', '2018-01-18T02:00:00.000000000', '2018-01-19T02:00:00.000000000', '2018-01-20T02:00:00.000000000', '2018-01-21T02:00:00.000000000', '2018-01-22T02:00:00.000000000', '2018-01-23T02:00:00.000000000', '2018-01-24T02:00:00.000000000', '2018-01-25T02:00:00.000000000', '2018-01-26T02:00:00.000000000', '2018-01-27T02:00:00.000000000', '2018-01-28T02:00:00.000000000', '2018-01-29T02:00:00.000000000', '2018-01-30T02:00:00.000000000', '2018-01-31T02:00:00.000000000'], dtype='datetime64[ns]') - latitude(latitude)float64-28.7 -28.67 ... -7.066 -7.036
- units :
- degrees_north
- long_name :
- Latitude
- standard_name :
- latitude
- projection :
- geographic
- coordinate_type :
- latitude
- _CoordinateAxisType :
- Lat
array([-28.696022, -28.666022, -28.636022, ..., -7.096022, -7.066022, -7.036022]) - longitude(longitude)float64142.2 142.2 142.2 ... 156.8 156.9
- units :
- degrees_east
- long_name :
- Longitude
- standard_name :
- longitude
- projection :
- geographic
- coordinate_type :
- longitude
- _CoordinateAxisType :
- Lon
array([142.168788, 142.198788, 142.228788, ..., 156.808788, 156.838788, 156.868788])
- alk(time, k, latitude, longitude)float32dask.array<chunksize=(31, 17, 723, 491), meta=np.ndarray>
- short_name :
- alk
- units :
- mmol m-3
- long_name :
- Total alkalinity
- _ChunkSizes :
- [ 1 1 133 491]
Array Chunk Bytes 748.33 MB 748.33 MB Shape (31, 17, 723, 491) (31, 17, 723, 491) Count 2 Tasks 1 Chunks Type float32 numpy.ndarray - BOD(time, k, latitude, longitude)float32dask.array<chunksize=(31, 17, 723, 491), meta=np.ndarray>
- short_name :
- BOD
- units :
- mg O m-3
- long_name :
- Biochemical Oxygen Demand
- _ChunkSizes :
- [ 1 1 133 491]
Array Chunk Bytes 748.33 MB 748.33 MB Shape (31, 17, 723, 491) (31, 17, 723, 491) Count 2 Tasks 1 Chunks Type float32 numpy.ndarray - Chl_a_sum(time, k, latitude, longitude)float32dask.array<chunksize=(31, 17, 723, 491), meta=np.ndarray>
- short_name :
- Chl_a_sum
- units :
- mg Chl m-3
- long_name :
- Total Chlorophyll
- _ChunkSizes :
- [ 1 1 133 491]
Array Chunk Bytes 748.33 MB 748.33 MB Shape (31, 17, 723, 491) (31, 17, 723, 491) Count 2 Tasks 1 Chunks Type float32 numpy.ndarray - CO32(time, k, latitude, longitude)float32dask.array<chunksize=(31, 17, 723, 491), meta=np.ndarray>
- short_name :
- CO32
- units :
- mmol m-3
- long_name :
- Carbonate
- _ChunkSizes :
- [ 1 1 133 491]
Array Chunk Bytes 748.33 MB 748.33 MB Shape (31, 17, 723, 491) (31, 17, 723, 491) Count 2 Tasks 1 Chunks Type float32 numpy.ndarray - DIC(time, k, latitude, longitude)float32dask.array<chunksize=(31, 17, 723, 491), meta=np.ndarray>
- short_name :
- DIC
- units :
- mg C m-3
- long_name :
- Dissolved Inorganic Carbon
- _ChunkSizes :
- [ 1 1 133 491]
Array Chunk Bytes 748.33 MB 748.33 MB Shape (31, 17, 723, 491) (31, 17, 723, 491) Count 2 Tasks 1 Chunks Type float32 numpy.ndarray - DIN(time, k, latitude, longitude)float32dask.array<chunksize=(31, 17, 723, 491), meta=np.ndarray>
- short_name :
- DIN
- units :
- mg N m-3
- long_name :
- Dissolved Inorganic Nitrogen
- _ChunkSizes :
- [ 1 1 133 491]
Array Chunk Bytes 748.33 MB 748.33 MB Shape (31, 17, 723, 491) (31, 17, 723, 491) Count 2 Tasks 1 Chunks Type float32 numpy.ndarray - DIP(time, k, latitude, longitude)float32dask.array<chunksize=(31, 17, 723, 491), meta=np.ndarray>
- short_name :
- DIP
- units :
- mg P m-3
- long_name :
- Dissolved Inorganic Phosphorus
- _ChunkSizes :
- [ 1 1 133 491]
Array Chunk Bytes 748.33 MB 748.33 MB Shape (31, 17, 723, 491) (31, 17, 723, 491) Count 2 Tasks 1 Chunks Type float32 numpy.ndarray - DOR_C(time, k, latitude, longitude)float32dask.array<chunksize=(31, 17, 723, 491), meta=np.ndarray>
- short_name :
- DOR_C
- units :
- mg C m-3
- long_name :
- Dissolved Organic Carbon
- _ChunkSizes :
- [ 1 1 133 491]
Array Chunk Bytes 748.33 MB 748.33 MB Shape (31, 17, 723, 491) (31, 17, 723, 491) Count 2 Tasks 1 Chunks Type float32 numpy.ndarray - DOR_N(time, k, latitude, longitude)float32dask.array<chunksize=(31, 17, 723, 491), meta=np.ndarray>
- short_name :
- DOR_N
- units :
- mg N m-3
- long_name :
- Dissolved Organic Nitrogen
- _ChunkSizes :
- [ 1 1 133 491]
Array Chunk Bytes 748.33 MB 748.33 MB Shape (31, 17, 723, 491) (31, 17, 723, 491) Count 2 Tasks 1 Chunks Type float32 numpy.ndarray - DOR_P(time, k, latitude, longitude)float32dask.array<chunksize=(31, 17, 723, 491), meta=np.ndarray>
- short_name :
- DOR_P
- units :
- mg P m-3
- long_name :
- Dissolved Organic Phosphorus
- _ChunkSizes :
- [ 1 1 133 491]
Array Chunk Bytes 748.33 MB 748.33 MB Shape (31, 17, 723, 491) (31, 17, 723, 491) Count 2 Tasks 1 Chunks Type float32 numpy.ndarray - Dust(time, k, latitude, longitude)float32dask.array<chunksize=(31, 17, 723, 491), meta=np.ndarray>
- short_name :
- Dust
- units :
- kg m-3
- long_name :
- Dust
- _ChunkSizes :
- [ 1 1 133 491]
Array Chunk Bytes 748.33 MB 748.33 MB Shape (31, 17, 723, 491) (31, 17, 723, 491) Count 2 Tasks 1 Chunks Type float32 numpy.ndarray - EFI(time, k, latitude, longitude)float32dask.array<chunksize=(31, 17, 723, 491), meta=np.ndarray>
- short_name :
- EFI
- units :
- kg m-3
- long_name :
- Ecology Fine Inorganics
- _ChunkSizes :
- [ 1 1 133 491]
Array Chunk Bytes 748.33 MB 748.33 MB Shape (31, 17, 723, 491) (31, 17, 723, 491) Count 2 Tasks 1 Chunks Type float32 numpy.ndarray - FineSed(time, k, latitude, longitude)float32dask.array<chunksize=(31, 17, 723, 491), meta=np.ndarray>
- short_name :
- FineSed
- units :
- kg m-3
- long_name :
- FineSed
- _ChunkSizes :
- [ 1 1 133 491]
Array Chunk Bytes 748.33 MB 748.33 MB Shape (31, 17, 723, 491) (31, 17, 723, 491) Count 2 Tasks 1 Chunks Type float32 numpy.ndarray - Fluorescence(time, k, latitude, longitude)float32dask.array<chunksize=(31, 17, 723, 491), meta=np.ndarray>
- short_name :
- Fluorescence
- units :
- mg chla m-3
- long_name :
- Simulated Fluorescence
- _ChunkSizes :
- [ 1 1 133 491]
Array Chunk Bytes 748.33 MB 748.33 MB Shape (31, 17, 723, 491) (31, 17, 723, 491) Count 2 Tasks 1 Chunks Type float32 numpy.ndarray - HCO3(time, k, latitude, longitude)float32dask.array<chunksize=(31, 17, 723, 491), meta=np.ndarray>
- short_name :
- HCO3
- units :
- mmol m-3
- long_name :
- Bicarbonate
- _ChunkSizes :
- [ 1 1 133 491]
Array Chunk Bytes 748.33 MB 748.33 MB Shape (31, 17, 723, 491) (31, 17, 723, 491) Count 2 Tasks 1 Chunks Type float32 numpy.ndarray - Kd_490(time, k, latitude, longitude)float32dask.array<chunksize=(31, 17, 723, 491), meta=np.ndarray>
- short_name :
- Kd_490
- units :
- m-1
- long_name :
- Vert. att. at 490 nm
- _ChunkSizes :
- [ 1 1 133 491]
Array Chunk Bytes 748.33 MB 748.33 MB Shape (31, 17, 723, 491) (31, 17, 723, 491) Count 2 Tasks 1 Chunks Type float32 numpy.ndarray - MPB_Chl(time, k, latitude, longitude)float32dask.array<chunksize=(31, 17, 723, 491), meta=np.ndarray>
- short_name :
- MPB_Chl
- units :
- mg Chl m-3
- long_name :
- Microphytobenthos chlorophyll
- _ChunkSizes :
- [ 1 1 133 491]
Array Chunk Bytes 748.33 MB 748.33 MB Shape (31, 17, 723, 491) (31, 17, 723, 491) Count 2 Tasks 1 Chunks Type float32 numpy.ndarray - MPB_N(time, k, latitude, longitude)float32dask.array<chunksize=(31, 17, 723, 491), meta=np.ndarray>
- short_name :
- MPB_N
- units :
- mg N m-3
- long_name :
- Microphytobenthos N
- _ChunkSizes :
- [ 1 1 133 491]
Array Chunk Bytes 748.33 MB 748.33 MB Shape (31, 17, 723, 491) (31, 17, 723, 491) Count 2 Tasks 1 Chunks Type float32 numpy.ndarray - Mud-carbonate(time, k, latitude, longitude)float32dask.array<chunksize=(31, 17, 723, 491), meta=np.ndarray>
- short_name :
- Mud-carbonate
- units :
- kg m-3
- long_name :
- Mud-carbonate
- _ChunkSizes :
- [ 1 1 133 491]
Array Chunk Bytes 748.33 MB 748.33 MB Shape (31, 17, 723, 491) (31, 17, 723, 491) Count 2 Tasks 1 Chunks Type float32 numpy.ndarray - Mud-mineral(time, k, latitude, longitude)float32dask.array<chunksize=(31, 17, 723, 491), meta=np.ndarray>
- short_name :
- Mud-mineral
- units :
- kg m-3
- long_name :
- Mud-mineral
- _ChunkSizes :
- [ 1 1 133 491]
Array Chunk Bytes 748.33 MB 748.33 MB Shape (31, 17, 723, 491) (31, 17, 723, 491) Count 2 Tasks 1 Chunks Type float32 numpy.ndarray - Nfix(time, k, latitude, longitude)float32dask.array<chunksize=(31, 17, 723, 491), meta=np.ndarray>
- short_name :
- Nfix
- units :
- mg N m-3 s-1
- long_name :
- N2 fixation
- _ChunkSizes :
- [ 1 1 133 491]
Array Chunk Bytes 748.33 MB 748.33 MB Shape (31, 17, 723, 491) (31, 17, 723, 491) Count 2 Tasks 1 Chunks Type float32 numpy.ndarray - NH4(time, k, latitude, longitude)float32dask.array<chunksize=(31, 17, 723, 491), meta=np.ndarray>
- short_name :
- NH4
- units :
- mg N m-3
- long_name :
- Ammonia
- _ChunkSizes :
- [ 1 1 133 491]
Array Chunk Bytes 748.33 MB 748.33 MB Shape (31, 17, 723, 491) (31, 17, 723, 491) Count 2 Tasks 1 Chunks Type float32 numpy.ndarray - NO3(time, k, latitude, longitude)float32dask.array<chunksize=(31, 17, 723, 491), meta=np.ndarray>
- short_name :
- NO3
- units :
- mg N m-3
- long_name :
- Nitrate
- _ChunkSizes :
- [ 1 1 133 491]
Array Chunk Bytes 748.33 MB 748.33 MB Shape (31, 17, 723, 491) (31, 17, 723, 491) Count 2 Tasks 1 Chunks Type float32 numpy.ndarray - omega_ar(time, k, latitude, longitude)float32dask.array<chunksize=(31, 17, 723, 491), meta=np.ndarray>
- short_name :
- omega_ar
- units :
- nil
- long_name :
- Aragonite saturation state
- _ChunkSizes :
- [ 1 1 133 491]
Array Chunk Bytes 748.33 MB 748.33 MB Shape (31, 17, 723, 491) (31, 17, 723, 491) Count 2 Tasks 1 Chunks Type float32 numpy.ndarray - Oxy_sat(time, k, latitude, longitude)float32dask.array<chunksize=(31, 17, 723, 491), meta=np.ndarray>
- short_name :
- Oxy_sat
- units :
- %
- long_name :
- Oxygen saturation percent
- _ChunkSizes :
- [ 1 1 133 491]
Array Chunk Bytes 748.33 MB 748.33 MB Shape (31, 17, 723, 491) (31, 17, 723, 491) Count 2 Tasks 1 Chunks Type float32 numpy.ndarray - Oxygen(time, k, latitude, longitude)float32dask.array<chunksize=(31, 17, 723, 491), meta=np.ndarray>
- short_name :
- Oxygen
- units :
- mg O m-3
- long_name :
- Dissolved Oxygen
- _ChunkSizes :
- [ 1 1 133 491]
Array Chunk Bytes 748.33 MB 748.33 MB Shape (31, 17, 723, 491) (31, 17, 723, 491) Count 2 Tasks 1 Chunks Type float32 numpy.ndarray - P_Prod(time, k, latitude, longitude)float32dask.array<chunksize=(31, 17, 723, 491), meta=np.ndarray>
- short_name :
- P_Prod
- units :
- mg C m-3 d-1
- long_name :
- Phytoplankton total productivity
- _ChunkSizes :
- [ 1 1 133 491]
Array Chunk Bytes 748.33 MB 748.33 MB Shape (31, 17, 723, 491) (31, 17, 723, 491) Count 2 Tasks 1 Chunks Type float32 numpy.ndarray - PAR(time, k, latitude, longitude)float32dask.array<chunksize=(31, 17, 723, 491), meta=np.ndarray>
- short_name :
- PAR
- units :
- mol photon m-2 s-1
- long_name :
- Av. PAR in layer
- _ChunkSizes :
- [ 1 1 133 491]
Array Chunk Bytes 748.33 MB 748.33 MB Shape (31, 17, 723, 491) (31, 17, 723, 491) Count 2 Tasks 1 Chunks Type float32 numpy.ndarray - PAR_z(time, k, latitude, longitude)float32dask.array<chunksize=(31, 17, 723, 491), meta=np.ndarray>
- short_name :
- PAR_z
- units :
- mol photon m-2 s-1
- long_name :
- Downwelling PAR at top of layer
- _ChunkSizes :
- [ 1 1 133 491]
Array Chunk Bytes 748.33 MB 748.33 MB Shape (31, 17, 723, 491) (31, 17, 723, 491) Count 2 Tasks 1 Chunks Type float32 numpy.ndarray - pco2surf(time, k, latitude, longitude)float32dask.array<chunksize=(31, 17, 723, 491), meta=np.ndarray>
- short_name :
- pco2surf
- units :
- ppmv
- long_name :
- oceanic pCO2 (ppmv)
- _ChunkSizes :
- [ 1 1 133 491]
Array Chunk Bytes 748.33 MB 748.33 MB Shape (31, 17, 723, 491) (31, 17, 723, 491) Count 2 Tasks 1 Chunks Type float32 numpy.ndarray - PH(time, k, latitude, longitude)float32dask.array<chunksize=(31, 17, 723, 491), meta=np.ndarray>
- short_name :
- PH
- units :
- log(mM)
- long_name :
- PH
- _ChunkSizes :
- [ 1 1 133 491]
Array Chunk Bytes 748.33 MB 748.33 MB Shape (31, 17, 723, 491) (31, 17, 723, 491) Count 2 Tasks 1 Chunks Type float32 numpy.ndarray - PhyL_Chl(time, k, latitude, longitude)float32dask.array<chunksize=(31, 17, 723, 491), meta=np.ndarray>
- short_name :
- PhyL_Chl
- units :
- mg Chl m-3
- long_name :
- Large Phytoplankton chlorophyll
- _ChunkSizes :
- [ 1 1 133 491]
Array Chunk Bytes 748.33 MB 748.33 MB Shape (31, 17, 723, 491) (31, 17, 723, 491) Count 2 Tasks 1 Chunks Type float32 numpy.ndarray - PhyL_N(time, k, latitude, longitude)float32dask.array<chunksize=(31, 17, 723, 491), meta=np.ndarray>
- short_name :
- PhyL_N
- units :
- mg N m-3
- long_name :
- Large Phytoplankton N
- _ChunkSizes :
- [ 1 1 133 491]
Array Chunk Bytes 748.33 MB 748.33 MB Shape (31, 17, 723, 491) (31, 17, 723, 491) Count 2 Tasks 1 Chunks Type float32 numpy.ndarray - PhyS_Chl(time, k, latitude, longitude)float32dask.array<chunksize=(31, 17, 723, 491), meta=np.ndarray>
- short_name :
- PhyS_Chl
- units :
- mg Chl m-3
- long_name :
- Small Phytoplankton chlorophyll
- _ChunkSizes :
- [ 1 1 133 491]
Array Chunk Bytes 748.33 MB 748.33 MB Shape (31, 17, 723, 491) (31, 17, 723, 491) Count 2 Tasks 1 Chunks Type float32 numpy.ndarray - PhyS_N(time, k, latitude, longitude)float32dask.array<chunksize=(31, 17, 723, 491), meta=np.ndarray>
- short_name :
- PhyS_N
- units :
- mg N m-3
- long_name :
- Small Phytoplankton N
- _ChunkSizes :
- [ 1 1 133 491]
Array Chunk Bytes 748.33 MB 748.33 MB Shape (31, 17, 723, 491) (31, 17, 723, 491) Count 2 Tasks 1 Chunks Type float32 numpy.ndarray - PhyS_NR(time, k, latitude, longitude)float32dask.array<chunksize=(31, 17, 723, 491), meta=np.ndarray>
- short_name :
- PhyS_NR
- units :
- mg N m-3
- long_name :
- Small Phytoplankton N reserve
- _ChunkSizes :
- [ 1 1 133 491]
Array Chunk Bytes 748.33 MB 748.33 MB Shape (31, 17, 723, 491) (31, 17, 723, 491) Count 2 Tasks 1 Chunks Type float32 numpy.ndarray - PIP(time, k, latitude, longitude)float32dask.array<chunksize=(31, 17, 723, 491), meta=np.ndarray>
- short_name :
- PIP
- units :
- mg P m-3
- long_name :
- Particulate Inorganic Phosphorus
- _ChunkSizes :
- [ 1 1 133 491]
Array Chunk Bytes 748.33 MB 748.33 MB Shape (31, 17, 723, 491) (31, 17, 723, 491) Count 2 Tasks 1 Chunks Type float32 numpy.ndarray - salt(time, k, latitude, longitude)float32dask.array<chunksize=(31, 17, 723, 491), meta=np.ndarray>
- short_name :
- salt
- units :
- PSU
- long_name :
- Salinity
- _ChunkSizes :
- [ 1 1 133 491]
Array Chunk Bytes 748.33 MB 748.33 MB Shape (31, 17, 723, 491) (31, 17, 723, 491) Count 2 Tasks 1 Chunks Type float32 numpy.ndarray - TC(time, k, latitude, longitude)float32dask.array<chunksize=(31, 17, 723, 491), meta=np.ndarray>
- short_name :
- TC
- units :
- mg C m-3
- long_name :
- Total C
- _ChunkSizes :
- [ 1 1 133 491]
Array Chunk Bytes 748.33 MB 748.33 MB Shape (31, 17, 723, 491) (31, 17, 723, 491) Count 2 Tasks 1 Chunks Type float32 numpy.ndarray - temp(time, k, latitude, longitude)float32dask.array<chunksize=(31, 17, 723, 491), meta=np.ndarray>
- short_name :
- temp
- units :
- degrees C
- long_name :
- Temperature
- _ChunkSizes :
- [ 1 1 133 491]
Array Chunk Bytes 748.33 MB 748.33 MB Shape (31, 17, 723, 491) (31, 17, 723, 491) Count 2 Tasks 1 Chunks Type float32 numpy.ndarray - TN(time, k, latitude, longitude)float32dask.array<chunksize=(31, 17, 723, 491), meta=np.ndarray>
- short_name :
- TN
- units :
- mg N m-3
- long_name :
- Total N
- _ChunkSizes :
- [ 1 1 133 491]
Array Chunk Bytes 748.33 MB 748.33 MB Shape (31, 17, 723, 491) (31, 17, 723, 491) Count 2 Tasks 1 Chunks Type float32 numpy.ndarray - TP(time, k, latitude, longitude)float32dask.array<chunksize=(31, 17, 723, 491), meta=np.ndarray>
- short_name :
- TP
- units :
- mg P m-3
- long_name :
- Total P
- _ChunkSizes :
- [ 1 1 133 491]
Array Chunk Bytes 748.33 MB 748.33 MB Shape (31, 17, 723, 491) (31, 17, 723, 491) Count 2 Tasks 1 Chunks Type float32 numpy.ndarray - Tricho_Chl(time, k, latitude, longitude)float32dask.array<chunksize=(31, 17, 723, 491), meta=np.ndarray>
- short_name :
- Tricho_Chl
- units :
- mg Chl m-3
- long_name :
- Trichodesmium chlorophyll
- _ChunkSizes :
- [ 1 1 133 491]
Array Chunk Bytes 748.33 MB 748.33 MB Shape (31, 17, 723, 491) (31, 17, 723, 491) Count 2 Tasks 1 Chunks Type float32 numpy.ndarray - Tricho_N(time, k, latitude, longitude)float32dask.array<chunksize=(31, 17, 723, 491), meta=np.ndarray>
- short_name :
- Tricho_N
- units :
- mg N m-3
- long_name :
- Trichodesmium Nitrogen
- _ChunkSizes :
- [ 1 1 133 491]
Array Chunk Bytes 748.33 MB 748.33 MB Shape (31, 17, 723, 491) (31, 17, 723, 491) Count 2 Tasks 1 Chunks Type float32 numpy.ndarray - Z_grazing(time, k, latitude, longitude)float32dask.array<chunksize=(31, 17, 723, 491), meta=np.ndarray>
- short_name :
- Z_grazing
- units :
- mg C m-3 d-1
- long_name :
- Zooplankton total grazing
- _ChunkSizes :
- [ 1 1 133 491]
Array Chunk Bytes 748.33 MB 748.33 MB Shape (31, 17, 723, 491) (31, 17, 723, 491) Count 2 Tasks 1 Chunks Type float32 numpy.ndarray - ZooL_N(time, k, latitude, longitude)float32dask.array<chunksize=(31, 17, 723, 491), meta=np.ndarray>
- short_name :
- ZooL_N
- units :
- mg N m-3
- long_name :
- Large Zooplankton N
- _ChunkSizes :
- [ 1 1 133 491]
Array Chunk Bytes 748.33 MB 748.33 MB Shape (31, 17, 723, 491) (31, 17, 723, 491) Count 2 Tasks 1 Chunks Type float32 numpy.ndarray - ZooS_N(time, k, latitude, longitude)float32dask.array<chunksize=(31, 17, 723, 491), meta=np.ndarray>
- short_name :
- ZooS_N
- units :
- mg N m-3
- long_name :
- Small Zooplankton N
- _ChunkSizes :
- [ 1 1 133 491]
Array Chunk Bytes 748.33 MB 748.33 MB Shape (31, 17, 723, 491) (31, 17, 723, 491) Count 2 Tasks 1 Chunks Type float32 numpy.ndarray - CH_N(time, latitude, longitude)float32dask.array<chunksize=(31, 723, 491), meta=np.ndarray>
- short_name :
- CH_N
- units :
- g N m-2
- long_name :
- Coral host N
- _ChunkSizes :
- [ 1 133 491]
Array Chunk Bytes 44.02 MB 44.02 MB Shape (31, 723, 491) (31, 723, 491) Count 2 Tasks 1 Chunks Type float32 numpy.ndarray - CS_bleach(time, latitude, longitude)float32dask.array<chunksize=(31, 723, 491), meta=np.ndarray>
- short_name :
- CS_bleach
- units :
- d-1
- long_name :
- Coral bleach rate
- _ChunkSizes :
- [ 1 133 491]
Array Chunk Bytes 44.02 MB 44.02 MB Shape (31, 723, 491) (31, 723, 491) Count 2 Tasks 1 Chunks Type float32 numpy.ndarray - CS_Chl(time, latitude, longitude)float32dask.array<chunksize=(31, 723, 491), meta=np.ndarray>
- short_name :
- CS_Chl
- units :
- mg Chl m-2
- long_name :
- Coral symbiont Chl
- _ChunkSizes :
- [ 1 133 491]
Array Chunk Bytes 44.02 MB 44.02 MB Shape (31, 723, 491) (31, 723, 491) Count 2 Tasks 1 Chunks Type float32 numpy.ndarray - CS_N(time, latitude, longitude)float32dask.array<chunksize=(31, 723, 491), meta=np.ndarray>
- short_name :
- CS_N
- units :
- mg N m-2
- long_name :
- Coral symbiont N
- _ChunkSizes :
- [ 1 133 491]
Array Chunk Bytes 44.02 MB 44.02 MB Shape (31, 723, 491) (31, 723, 491) Count 2 Tasks 1 Chunks Type float32 numpy.ndarray - EpiPAR_sg(time, latitude, longitude)float32dask.array<chunksize=(31, 723, 491), meta=np.ndarray>
- short_name :
- EpiPAR_sg
- units :
- mol photon m-2 d-1
- long_name :
- Light intensity above seagrass
- _ChunkSizes :
- [ 1 133 491]
Array Chunk Bytes 44.02 MB 44.02 MB Shape (31, 723, 491) (31, 723, 491) Count 2 Tasks 1 Chunks Type float32 numpy.ndarray - eta(time, latitude, longitude)float32dask.array<chunksize=(31, 723, 491), meta=np.ndarray>
- short_name :
- eta
- units :
- metre
- long_name :
- Surface Elevation
- _ChunkSizes :
- [ 1 133 491]
Array Chunk Bytes 44.02 MB 44.02 MB Shape (31, 723, 491) (31, 723, 491) Count 2 Tasks 1 Chunks Type float32 numpy.ndarray - MA_N(time, latitude, longitude)float32dask.array<chunksize=(31, 723, 491), meta=np.ndarray>
- short_name :
- MA_N
- units :
- g N m-2
- long_name :
- Macroalgae N
- _ChunkSizes :
- [ 1 133 491]
Array Chunk Bytes 44.02 MB 44.02 MB Shape (31, 723, 491) (31, 723, 491) Count 2 Tasks 1 Chunks Type float32 numpy.ndarray - MA_N_pr(time, latitude, longitude)float32dask.array<chunksize=(31, 723, 491), meta=np.ndarray>
- short_name :
- MA_N_pr
- units :
- mg N m-2 d-1
- long_name :
- Macroalgae net production
- _ChunkSizes :
- [ 1 133 491]
Array Chunk Bytes 44.02 MB 44.02 MB Shape (31, 723, 491) (31, 723, 491) Count 2 Tasks 1 Chunks Type float32 numpy.ndarray - month_EpiPAR_sg(time, latitude, longitude)float32dask.array<chunksize=(31, 723, 491), meta=np.ndarray>
- short_name :
- month_EpiPAR_sg
- units :
- mol photon m-2
- long_name :
- Monthly dose light above seagrass
- _ChunkSizes :
- [ 1 133 491]
Array Chunk Bytes 44.02 MB 44.02 MB Shape (31, 723, 491) (31, 723, 491) Count 2 Tasks 1 Chunks Type float32 numpy.ndarray - R_400(time, latitude, longitude)float32dask.array<chunksize=(31, 723, 491), meta=np.ndarray>
- short_name :
- R_400
- units :
- sr-1
- long_name :
- Remote-sensing reflectance @ 400 nm
- _ChunkSizes :
- [ 1 133 491]
Array Chunk Bytes 44.02 MB 44.02 MB Shape (31, 723, 491) (31, 723, 491) Count 2 Tasks 1 Chunks Type float32 numpy.ndarray - R_410(time, latitude, longitude)float32dask.array<chunksize=(31, 723, 491), meta=np.ndarray>
- short_name :
- R_410
- units :
- sr-1
- long_name :
- Remote-sensing reflectance @ 410 nm
- _ChunkSizes :
- [ 1 133 491]
Array Chunk Bytes 44.02 MB 44.02 MB Shape (31, 723, 491) (31, 723, 491) Count 2 Tasks 1 Chunks Type float32 numpy.ndarray - R_412(time, latitude, longitude)float32dask.array<chunksize=(31, 723, 491), meta=np.ndarray>
- short_name :
- R_412
- units :
- sr-1
- long_name :
- Remote-sensing reflectance @ 412 nm
- _ChunkSizes :
- [ 1 133 491]
Array Chunk Bytes 44.02 MB 44.02 MB Shape (31, 723, 491) (31, 723, 491) Count 2 Tasks 1 Chunks Type float32 numpy.ndarray - R_443(time, latitude, longitude)float32dask.array<chunksize=(31, 723, 491), meta=np.ndarray>
- short_name :
- R_443
- units :
- sr-1
- long_name :
- Remote-sensing reflectance @ 443 nm
- _ChunkSizes :
- [ 1 133 491]
Array Chunk Bytes 44.02 MB 44.02 MB Shape (31, 723, 491) (31, 723, 491) Count 2 Tasks 1 Chunks Type float32 numpy.ndarray - R_470(time, latitude, longitude)float32dask.array<chunksize=(31, 723, 491), meta=np.ndarray>
- short_name :
- R_470
- units :
- sr-1
- long_name :
- Remote-sensing reflectance @ 470 nm
- _ChunkSizes :
- [ 1 133 491]
Array Chunk Bytes 44.02 MB 44.02 MB Shape (31, 723, 491) (31, 723, 491) Count 2 Tasks 1 Chunks Type float32 numpy.ndarray - R_486(time, latitude, longitude)float32dask.array<chunksize=(31, 723, 491), meta=np.ndarray>
- short_name :
- R_486
- units :
- sr-1
- long_name :
- Remote-sensing reflectance @ 486 nm
- _ChunkSizes :
- [ 1 133 491]
Array Chunk Bytes 44.02 MB 44.02 MB Shape (31, 723, 491) (31, 723, 491) Count 2 Tasks 1 Chunks Type float32 numpy.ndarray - R_488(time, latitude, longitude)float32dask.array<chunksize=(31, 723, 491), meta=np.ndarray>
- short_name :
- R_488
- units :
- sr-1
- long_name :
- Remote-sensing reflectance @ 488 nm
- _ChunkSizes :
- [ 1 133 491]
Array Chunk Bytes 44.02 MB 44.02 MB Shape (31, 723, 491) (31, 723, 491) Count 2 Tasks 1 Chunks Type float32 numpy.ndarray - R_490(time, latitude, longitude)float32dask.array<chunksize=(31, 723, 491), meta=np.ndarray>
- short_name :
- R_490
- units :
- sr-1
- long_name :
- Remote-sensing reflectance @ 490 nm
- _ChunkSizes :
- [ 1 133 491]
Array Chunk Bytes 44.02 MB 44.02 MB Shape (31, 723, 491) (31, 723, 491) Count 2 Tasks 1 Chunks Type float32 numpy.ndarray - R_510(time, latitude, longitude)float32dask.array<chunksize=(31, 723, 491), meta=np.ndarray>
- short_name :
- R_510
- units :
- sr-1
- long_name :
- Remote-sensing reflectance @ 510 nm
- _ChunkSizes :
- [ 1 133 491]
Array Chunk Bytes 44.02 MB 44.02 MB Shape (31, 723, 491) (31, 723, 491) Count 2 Tasks 1 Chunks Type float32 numpy.ndarray - R_531(time, latitude, longitude)float32dask.array<chunksize=(31, 723, 491), meta=np.ndarray>
- short_name :
- R_531
- units :
- sr-1
- long_name :
- Remote-sensing reflectance @ 531 nm
- _ChunkSizes :
- [ 1 133 491]
Array Chunk Bytes 44.02 MB 44.02 MB Shape (31, 723, 491) (31, 723, 491) Count 2 Tasks 1 Chunks Type float32 numpy.ndarray - R_547(time, latitude, longitude)float32dask.array<chunksize=(31, 723, 491), meta=np.ndarray>
- short_name :
- R_547
- units :
- sr-1
- long_name :
- Remote-sensing reflectance @ 547 nm
- _ChunkSizes :
- [ 1 133 491]
Array Chunk Bytes 44.02 MB 44.02 MB Shape (31, 723, 491) (31, 723, 491) Count 2 Tasks 1 Chunks Type float32 numpy.ndarray - R_551(time, latitude, longitude)float32dask.array<chunksize=(31, 723, 491), meta=np.ndarray>
- short_name :
- R_551
- units :
- sr-1
- long_name :
- Remote-sensing reflectance @ 551 nm
- _ChunkSizes :
- [ 1 133 491]
Array Chunk Bytes 44.02 MB 44.02 MB Shape (31, 723, 491) (31, 723, 491) Count 2 Tasks 1 Chunks Type float32 numpy.ndarray - R_555(time, latitude, longitude)float32dask.array<chunksize=(31, 723, 491), meta=np.ndarray>
- short_name :
- R_555
- units :
- sr-1
- long_name :
- Remote-sensing reflectance @ 555 nm
- _ChunkSizes :
- [ 1 133 491]
Array Chunk Bytes 44.02 MB 44.02 MB Shape (31, 723, 491) (31, 723, 491) Count 2 Tasks 1 Chunks Type float32 numpy.ndarray - R_560(time, latitude, longitude)float32dask.array<chunksize=(31, 723, 491), meta=np.ndarray>
- short_name :
- R_560
- units :
- sr-1
- long_name :
- Remote-sensing reflectance @ 560 nm
- _ChunkSizes :
- [ 1 133 491]
Array Chunk Bytes 44.02 MB 44.02 MB Shape (31, 723, 491) (31, 723, 491) Count 2 Tasks 1 Chunks Type float32 numpy.ndarray - R_590(time, latitude, longitude)float32dask.array<chunksize=(31, 723, 491), meta=np.ndarray>
- short_name :
- R_590
- units :
- sr-1
- long_name :
- Remote-sensing reflectance @ 590 nm
- _ChunkSizes :
- [ 1 133 491]
Array Chunk Bytes 44.02 MB 44.02 MB Shape (31, 723, 491) (31, 723, 491) Count 2 Tasks 1 Chunks Type float32 numpy.ndarray - R_620(time, latitude, longitude)float32dask.array<chunksize=(31, 723, 491), meta=np.ndarray>
- short_name :
- R_620
- units :
- sr-1
- long_name :
- Remote-sensing reflectance @ 620 nm
- _ChunkSizes :
- [ 1 133 491]
Array Chunk Bytes 44.02 MB 44.02 MB Shape (31, 723, 491) (31, 723, 491) Count 2 Tasks 1 Chunks Type float32 numpy.ndarray - R_640(time, latitude, longitude)float32dask.array<chunksize=(31, 723, 491), meta=np.ndarray>
- short_name :
- R_640
- units :
- sr-1
- long_name :
- Remote-sensing reflectance @ 640 nm
- _ChunkSizes :
- [ 1 133 491]
Array Chunk Bytes 44.02 MB 44.02 MB Shape (31, 723, 491) (31, 723, 491) Count 2 Tasks 1 Chunks Type float32 numpy.ndarray - R_645(time, latitude, longitude)float32dask.array<chunksize=(31, 723, 491), meta=np.ndarray>
- short_name :
- R_645
- units :
- sr-1
- long_name :
- Remote-sensing reflectance @ 645 nm
- _ChunkSizes :
- [ 1 133 491]
Array Chunk Bytes 44.02 MB 44.02 MB Shape (31, 723, 491) (31, 723, 491) Count 2 Tasks 1 Chunks Type float32 numpy.ndarray - R_665(time, latitude, longitude)float32dask.array<chunksize=(31, 723, 491), meta=np.ndarray>
- short_name :
- R_665
- units :
- sr-1
- long_name :
- Remote-sensing reflectance @ 665 nm
- _ChunkSizes :
- [ 1 133 491]
Array Chunk Bytes 44.02 MB 44.02 MB Shape (31, 723, 491) (31, 723, 491) Count 2 Tasks 1 Chunks Type float32 numpy.ndarray - R_667(time, latitude, longitude)float32dask.array<chunksize=(31, 723, 491), meta=np.ndarray>
- short_name :
- R_667
- units :
- sr-1
- long_name :
- Remote-sensing reflectance @ 667 nm
- _ChunkSizes :
- [ 1 133 491]
Array Chunk Bytes 44.02 MB 44.02 MB Shape (31, 723, 491) (31, 723, 491) Count 2 Tasks 1 Chunks Type float32 numpy.ndarray - R_671(time, latitude, longitude)float32dask.array<chunksize=(31, 723, 491), meta=np.ndarray>
- short_name :
- R_671
- units :
- sr-1
- long_name :
- Remote-sensing reflectance @ 671 nm
- _ChunkSizes :
- [ 1 133 491]
Array Chunk Bytes 44.02 MB 44.02 MB Shape (31, 723, 491) (31, 723, 491) Count 2 Tasks 1 Chunks Type float32 numpy.ndarray - R_673(time, latitude, longitude)float32dask.array<chunksize=(31, 723, 491), meta=np.ndarray>
- short_name :
- R_673
- units :
- sr-1
- long_name :
- Remote-sensing reflectance @ 673 nm
- _ChunkSizes :
- [ 1 133 491]
Array Chunk Bytes 44.02 MB 44.02 MB Shape (31, 723, 491) (31, 723, 491) Count 2 Tasks 1 Chunks Type float32 numpy.ndarray - R_678(time, latitude, longitude)float32dask.array<chunksize=(31, 723, 491), meta=np.ndarray>
- short_name :
- R_678
- units :
- sr-1
- long_name :
- Remote-sensing reflectance @ 678 nm
- _ChunkSizes :
- [ 1 133 491]
Array Chunk Bytes 44.02 MB 44.02 MB Shape (31, 723, 491) (31, 723, 491) Count 2 Tasks 1 Chunks Type float32 numpy.ndarray - R_681(time, latitude, longitude)float32dask.array<chunksize=(31, 723, 491), meta=np.ndarray>
- short_name :
- R_681
- units :
- sr-1
- long_name :
- Remote-sensing reflectance @ 681 nm
- _ChunkSizes :
- [ 1 133 491]
Array Chunk Bytes 44.02 MB 44.02 MB Shape (31, 723, 491) (31, 723, 491) Count 2 Tasks 1 Chunks Type float32 numpy.ndarray - R_709(time, latitude, longitude)float32dask.array<chunksize=(31, 723, 491), meta=np.ndarray>
- short_name :
- R_709
- units :
- sr-1
- long_name :
- Remote-sensing reflectance @ 709 nm
- _ChunkSizes :
- [ 1 133 491]
Array Chunk Bytes 44.02 MB 44.02 MB Shape (31, 723, 491) (31, 723, 491) Count 2 Tasks 1 Chunks Type float32 numpy.ndarray - R_745(time, latitude, longitude)float32dask.array<chunksize=(31, 723, 491), meta=np.ndarray>
- short_name :
- R_745
- units :
- sr-1
- long_name :
- Remote-sensing reflectance @ 745 nm
- _ChunkSizes :
- [ 1 133 491]
Array Chunk Bytes 44.02 MB 44.02 MB Shape (31, 723, 491) (31, 723, 491) Count 2 Tasks 1 Chunks Type float32 numpy.ndarray - R_748(time, latitude, longitude)float32dask.array<chunksize=(31, 723, 491), meta=np.ndarray>
- short_name :
- R_748
- units :
- sr-1
- long_name :
- Remote-sensing reflectance @ 748 nm
- _ChunkSizes :
- [ 1 133 491]
Array Chunk Bytes 44.02 MB 44.02 MB Shape (31, 723, 491) (31, 723, 491) Count 2 Tasks 1 Chunks Type float32 numpy.ndarray - R_754(time, latitude, longitude)float32dask.array<chunksize=(31, 723, 491), meta=np.ndarray>
- short_name :
- R_754
- units :
- sr-1
- long_name :
- Remote-sensing reflectance @ 754 nm
- _ChunkSizes :
- [ 1 133 491]
Array Chunk Bytes 44.02 MB 44.02 MB Shape (31, 723, 491) (31, 723, 491) Count 2 Tasks 1 Chunks Type float32 numpy.ndarray - R_761(time, latitude, longitude)float32dask.array<chunksize=(31, 723, 491), meta=np.ndarray>
- short_name :
- R_761
- units :
- sr-1
- long_name :
- Remote-sensing reflectance @ 761 nm
- _ChunkSizes :
- [ 1 133 491]
Array Chunk Bytes 44.02 MB 44.02 MB Shape (31, 723, 491) (31, 723, 491) Count 2 Tasks 1 Chunks Type float32 numpy.ndarray - R_764(time, latitude, longitude)float32dask.array<chunksize=(31, 723, 491), meta=np.ndarray>
- short_name :
- R_764
- units :
- sr-1
- long_name :
- Remote-sensing reflectance @ 764 nm
- _ChunkSizes :
- [ 1 133 491]
Array Chunk Bytes 44.02 MB 44.02 MB Shape (31, 723, 491) (31, 723, 491) Count 2 Tasks 1 Chunks Type float32 numpy.ndarray - R_767(time, latitude, longitude)float32dask.array<chunksize=(31, 723, 491), meta=np.ndarray>
- short_name :
- R_767
- units :
- sr-1
- long_name :
- Remote-sensing reflectance @ 767 nm
- _ChunkSizes :
- [ 1 133 491]
Array Chunk Bytes 44.02 MB 44.02 MB Shape (31, 723, 491) (31, 723, 491) Count 2 Tasks 1 Chunks Type float32 numpy.ndarray - R_778(time, latitude, longitude)float32dask.array<chunksize=(31, 723, 491), meta=np.ndarray>
- short_name :
- R_778
- units :
- sr-1
- long_name :
- Remote-sensing reflectance @ 778 nm
- _ChunkSizes :
- [ 1 133 491]
Array Chunk Bytes 44.02 MB 44.02 MB Shape (31, 723, 491) (31, 723, 491) Count 2 Tasks 1 Chunks Type float32 numpy.ndarray - Secchi(time, latitude, longitude)float32dask.array<chunksize=(31, 723, 491), meta=np.ndarray>
- short_name :
- Secchi
- units :
- m
- long_name :
- Secchi from 488 nm
- _ChunkSizes :
- [ 1 133 491]
Array Chunk Bytes 44.02 MB 44.02 MB Shape (31, 723, 491) (31, 723, 491) Count 2 Tasks 1 Chunks Type float32 numpy.ndarray - SG_N(time, latitude, longitude)float32dask.array<chunksize=(31, 723, 491), meta=np.ndarray>
- short_name :
- SG_N
- units :
- g N m-2
- long_name :
- Seagrass N
- _ChunkSizes :
- [ 1 133 491]
Array Chunk Bytes 44.02 MB 44.02 MB Shape (31, 723, 491) (31, 723, 491) Count 2 Tasks 1 Chunks Type float32 numpy.ndarray - SG_N_pr(time, latitude, longitude)float32dask.array<chunksize=(31, 723, 491), meta=np.ndarray>
- short_name :
- SG_N_pr
- units :
- mg N m-2 d-1
- long_name :
- Seagrass net production
- _ChunkSizes :
- [ 1 133 491]
Array Chunk Bytes 44.02 MB 44.02 MB Shape (31, 723, 491) (31, 723, 491) Count 2 Tasks 1 Chunks Type float32 numpy.ndarray - SG_shear_mort(time, latitude, longitude)float32dask.array<chunksize=(31, 723, 491), meta=np.ndarray>
- short_name :
- SG_shear_mort
- units :
- g N m-2 d-1
- long_name :
- Seagrass shear stress mort
- _ChunkSizes :
- [ 1 133 491]
Array Chunk Bytes 44.02 MB 44.02 MB Shape (31, 723, 491) (31, 723, 491) Count 2 Tasks 1 Chunks Type float32 numpy.ndarray - SGD_N(time, latitude, longitude)float32dask.array<chunksize=(31, 723, 491), meta=np.ndarray>
- short_name :
- SGD_N
- units :
- g N m-2
- long_name :
- Deep seagrass N
- _ChunkSizes :
- [ 1 133 491]
Array Chunk Bytes 44.02 MB 44.02 MB Shape (31, 723, 491) (31, 723, 491) Count 2 Tasks 1 Chunks Type float32 numpy.ndarray - SGD_N_pr(time, latitude, longitude)float32dask.array<chunksize=(31, 723, 491), meta=np.ndarray>
- short_name :
- SGD_N_pr
- units :
- mg N m-2 d-1
- long_name :
- Deep seagrass net production
- _ChunkSizes :
- [ 1 133 491]
Array Chunk Bytes 44.02 MB 44.02 MB Shape (31, 723, 491) (31, 723, 491) Count 2 Tasks 1 Chunks Type float32 numpy.ndarray - SGD_shear_mort(time, latitude, longitude)float32dask.array<chunksize=(31, 723, 491), meta=np.ndarray>
- short_name :
- SGD_shear_mort
- units :
- g N m-2 d-1
- long_name :
- Deep seagrass shear stress mort
- _ChunkSizes :
- [ 1 133 491]
Array Chunk Bytes 44.02 MB 44.02 MB Shape (31, 723, 491) (31, 723, 491) Count 2 Tasks 1 Chunks Type float32 numpy.ndarray - SGH_N(time, latitude, longitude)float32dask.array<chunksize=(31, 723, 491), meta=np.ndarray>
- short_name :
- SGH_N
- units :
- g N m-2
- long_name :
- Halophila N
- _ChunkSizes :
- [ 1 133 491]
Array Chunk Bytes 44.02 MB 44.02 MB Shape (31, 723, 491) (31, 723, 491) Count 2 Tasks 1 Chunks Type float32 numpy.ndarray - SGH_N_pr(time, latitude, longitude)float32dask.array<chunksize=(31, 723, 491), meta=np.ndarray>
- short_name :
- SGH_N_pr
- units :
- mg N m-2 d-1
- long_name :
- Halophila net production
- _ChunkSizes :
- [ 1 133 491]
Array Chunk Bytes 44.02 MB 44.02 MB Shape (31, 723, 491) (31, 723, 491) Count 2 Tasks 1 Chunks Type float32 numpy.ndarray - SGHROOT_N(time, latitude, longitude)float32dask.array<chunksize=(31, 723, 491), meta=np.ndarray>
- short_name :
- SGHROOT_N
- units :
- g N m-2
- long_name :
- Halophila root N
- _ChunkSizes :
- [ 1 133 491]
Array Chunk Bytes 44.02 MB 44.02 MB Shape (31, 723, 491) (31, 723, 491) Count 2 Tasks 1 Chunks Type float32 numpy.ndarray - SGROOT_N(time, latitude, longitude)float32dask.array<chunksize=(31, 723, 491), meta=np.ndarray>
- short_name :
- SGROOT_N
- units :
- g N m-2
- long_name :
- Seagrass root N
- _ChunkSizes :
- [ 1 133 491]
Array Chunk Bytes 44.02 MB 44.02 MB Shape (31, 723, 491) (31, 723, 491) Count 2 Tasks 1 Chunks Type float32 numpy.ndarray - TSSM(time, latitude, longitude)float32dask.array<chunksize=(31, 723, 491), meta=np.ndarray>
- short_name :
- TSSM
- units :
- g TSS m-3
- long_name :
- TSS from 645 nm (Petus et al., 2014)
- _ChunkSizes :
- [ 1 133 491]
Array Chunk Bytes 44.02 MB 44.02 MB Shape (31, 723, 491) (31, 723, 491) Count 2 Tasks 1 Chunks Type float32 numpy.ndarray - Zenith2D(time, latitude, longitude)float32dask.array<chunksize=(31, 723, 491), meta=np.ndarray>
- short_name :
- Zenith2D
- units :
- rad
- long_name :
- Solar zenith
- _ChunkSizes :
- [ 1 133 491]
Array Chunk Bytes 44.02 MB 44.02 MB Shape (31, 723, 491) (31, 723, 491) Count 2 Tasks 1 Chunks Type float32 numpy.ndarray
- Conventions :
- CF-1.0
- NCO :
- netCDF Operators version 4.7.7 (Homepage = http://nco.sf.net, Code = http://github.com/nco/nco)
- RunID :
- 2
- _CoordSysBuilder :
- ucar.nc2.dataset.conv.CF1Convention
- aims_ncaggregate_buildDate :
- 2020-08-21T23:07:30+10:00
- aims_ncaggregate_datasetId :
- products__ncaggregate__ereefs__GBR4_H2p0_B3p1_Cq3b_Dhnd__daily-monthly/EREEFS_AIMS-CSIRO_GBR4_H2p0_B3p1_Cq3b_Dhnd_bgc_daily-monthly-2018-01
- aims_ncaggregate_firstDate :
- 2018-01-01T12:00:00+10:00
- aims_ncaggregate_inputs :
- [products__ncaggregate__ereefs__GBR4_H2p0_B3p1_Cq3b_Dhnd__raw/EREEFS_AIMS-CSIRO_GBR4_H2p0_B3p1_Cq3b_Dhnd_bgc_raw_2018-01::MD5:922cfd031369e604eab88561e411dc0e]
- aims_ncaggregate_lastDate :
- 2018-01-31T12:00:00+10:00
- codehead :
- CSIRO Environmental Modelling Suite
- description :
- Regridding of daily input data (from eReefs AIMS-CSIRO GBR4 BioGeoChemical 3.1 subset) from curvilinear (per input data) to rectilinear via inverse weighted distance from up to 4 closest cells.
- ems_version :
- v1.1.1 rev(6244M)
- history :
- Tue Oct 8 15:38:27 2019: ncatted -a positive,botz,o,char,up -a missing_value,botz,o,double,99. -a outside,botz,o,double,-9999. gbr4_bgc_all_simple_2018-01.nc 2020-08-20T23:45:30+10:00: vendor: AIMS; processing: None summaries 2020-08-21T23:07:30+10:00: vendor: AIMS; processing: None summaries
- metadata_link :
- https://eatlas.org.au/data/uuid/61f3a6df-2c4a-46b6-ab62-3f3a9bf4e87a
- paramfile :
- /home/bai155/EMS_solar2/gbr4_H2p0_B3p1_Cb/tran/GBR4_H2p0_B3p1_Cq3b_Dhnd.tran
- paramhead :
- eReefs 4 km grid. SOURCE Catchments with 2019 condition from Dec 1, 2010 to June,30, 2018, Empirical SOURCE with 2019 condition, Jul 1, 2018 to April 30, 2019. More details of naming protocol at: eReefs.info.
- technical_guide_link :
- https://eatlas.org.au/pydio/public/aims-ereefs-platform-technical-guide-to-derived-products-from-csiro-ereefs-models-pdf
- technical_guide_publish_date :
- 2020-08-18
- title :
- eReefs AIMS-CSIRO GBR4 BioGeoChemical 3.1 (baseline catchment conditions) daily aggregation
- DODS_EXTRA.Unlimited_Dimension :
- time
Change coordinate name
To make it easier to process the xArray dataset, we change the zc coordinate to the same name as its dimension (i.e. k).
This is done like this:
# Creation of a new coordinate k with the same array as zc
ds_bio.coords['k'] = ('zc',ds_bio.zc)
# Swapping `zc` with `k`
ds_bio = ds_bio.swap_dims({'zc':'k'})
# Ok we can now safely remove `zc`
ds_bio = ds_bio.drop(['zc'])
ds_bio
<xarray.Dataset>
Dimensions: (k: 17, latitude: 723, longitude: 491, time: 31)
Coordinates:
* time (time) datetime64[ns] 2018-01-01T02:00:00 ... 2018-01-31...
* latitude (latitude) float64 -28.7 -28.67 -28.64 ... -7.066 -7.036
* longitude (longitude) float64 142.2 142.2 142.2 ... 156.8 156.8 156.9
* k (k) float64 -145.0 -120.0 -103.0 -88.0 ... -3.0 -1.5 -0.5
Data variables: (12/101)
alk (time, k, latitude, longitude) float32 dask.array<chunksize=(31, 17, 723, 491), meta=np.ndarray>
BOD (time, k, latitude, longitude) float32 dask.array<chunksize=(31, 17, 723, 491), meta=np.ndarray>
Chl_a_sum (time, k, latitude, longitude) float32 dask.array<chunksize=(31, 17, 723, 491), meta=np.ndarray>
CO32 (time, k, latitude, longitude) float32 dask.array<chunksize=(31, 17, 723, 491), meta=np.ndarray>
DIC (time, k, latitude, longitude) float32 dask.array<chunksize=(31, 17, 723, 491), meta=np.ndarray>
DIN (time, k, latitude, longitude) float32 dask.array<chunksize=(31, 17, 723, 491), meta=np.ndarray>
... ...
SGH_N (time, latitude, longitude) float32 dask.array<chunksize=(31, 723, 491), meta=np.ndarray>
SGH_N_pr (time, latitude, longitude) float32 dask.array<chunksize=(31, 723, 491), meta=np.ndarray>
SGHROOT_N (time, latitude, longitude) float32 dask.array<chunksize=(31, 723, 491), meta=np.ndarray>
SGROOT_N (time, latitude, longitude) float32 dask.array<chunksize=(31, 723, 491), meta=np.ndarray>
TSSM (time, latitude, longitude) float32 dask.array<chunksize=(31, 723, 491), meta=np.ndarray>
Zenith2D (time, latitude, longitude) float32 dask.array<chunksize=(31, 723, 491), meta=np.ndarray>
Attributes: (12/20)
Conventions: CF-1.0
NCO: netCDF Operators version 4.7.7 (Homepage...
RunID: 2
_CoordSysBuilder: ucar.nc2.dataset.conv.CF1Convention
aims_ncaggregate_buildDate: 2020-08-21T23:07:30+10:00
aims_ncaggregate_datasetId: products__ncaggregate__ereefs__GBR4_H2p0...
... ...
paramfile: /home/bai155/EMS_solar2/gbr4_H2p0_B3p1_C...
paramhead: eReefs 4 km grid. SOURCE Catchments with...
technical_guide_link: https://eatlas.org.au/pydio/public/aims-...
technical_guide_publish_date: 2020-08-18
title: eReefs AIMS-CSIRO GBR4 BioGeoChemical 3....
DODS_EXTRA.Unlimited_Dimension: time- k: 17
- latitude: 723
- longitude: 491
- time: 31
- time(time)datetime64[ns]2018-01-01T02:00:00 ... 2018-01-...
- long_name :
- Time
- standard_name :
- time
- coordinate_type :
- time
- _CoordinateAxisType :
- Time
- _ChunkSizes :
- 1024
array(['2018-01-01T02:00:00.000000000', '2018-01-02T02:00:00.000000000', '2018-01-03T02:00:00.000000000', '2018-01-04T02:00:00.000000000', '2018-01-05T02:00:00.000000000', '2018-01-06T02:00:00.000000000', '2018-01-07T02:00:00.000000000', '2018-01-08T02:00:00.000000000', '2018-01-09T02:00:00.000000000', '2018-01-10T02:00:00.000000000', '2018-01-11T02:00:00.000000000', '2018-01-12T02:00:00.000000000', '2018-01-13T02:00:00.000000000', '2018-01-14T02:00:00.000000000', '2018-01-15T02:00:00.000000000', '2018-01-16T02:00:00.000000000', '2018-01-17T02:00:00.000000000', '2018-01-18T02:00:00.000000000', '2018-01-19T02:00:00.000000000', '2018-01-20T02:00:00.000000000', '2018-01-21T02:00:00.000000000', '2018-01-22T02:00:00.000000000', '2018-01-23T02:00:00.000000000', '2018-01-24T02:00:00.000000000', '2018-01-25T02:00:00.000000000', '2018-01-26T02:00:00.000000000', '2018-01-27T02:00:00.000000000', '2018-01-28T02:00:00.000000000', '2018-01-29T02:00:00.000000000', '2018-01-30T02:00:00.000000000', '2018-01-31T02:00:00.000000000'], dtype='datetime64[ns]') - latitude(latitude)float64-28.7 -28.67 ... -7.066 -7.036
- units :
- degrees_north
- long_name :
- Latitude
- standard_name :
- latitude
- projection :
- geographic
- coordinate_type :
- latitude
- _CoordinateAxisType :
- Lat
array([-28.696022, -28.666022, -28.636022, ..., -7.096022, -7.066022, -7.036022]) - longitude(longitude)float64142.2 142.2 142.2 ... 156.8 156.9
- units :
- degrees_east
- long_name :
- Longitude
- standard_name :
- longitude
- projection :
- geographic
- coordinate_type :
- longitude
- _CoordinateAxisType :
- Lon
array([142.168788, 142.198788, 142.228788, ..., 156.808788, 156.838788, 156.868788]) - k(k)float64-145.0 -120.0 -103.0 ... -1.5 -0.5
array([-145. , -120. , -103. , -88. , -73. , -60. , -49. , -39.5 , -31. , -23.75, -17.75, -12.75, -8.8 , -5.55, -3. , -1.5 , -0.5 ])
- alk(time, k, latitude, longitude)float32dask.array<chunksize=(31, 17, 723, 491), meta=np.ndarray>
- short_name :
- alk
- units :
- mmol m-3
- long_name :
- Total alkalinity
- _ChunkSizes :
- [ 1 1 133 491]
Array Chunk Bytes 748.33 MB 748.33 MB Shape (31, 17, 723, 491) (31, 17, 723, 491) Count 2 Tasks 1 Chunks Type float32 numpy.ndarray - BOD(time, k, latitude, longitude)float32dask.array<chunksize=(31, 17, 723, 491), meta=np.ndarray>
- short_name :
- BOD
- units :
- mg O m-3
- long_name :
- Biochemical Oxygen Demand
- _ChunkSizes :
- [ 1 1 133 491]
Array Chunk Bytes 748.33 MB 748.33 MB Shape (31, 17, 723, 491) (31, 17, 723, 491) Count 2 Tasks 1 Chunks Type float32 numpy.ndarray - Chl_a_sum(time, k, latitude, longitude)float32dask.array<chunksize=(31, 17, 723, 491), meta=np.ndarray>
- short_name :
- Chl_a_sum
- units :
- mg Chl m-3
- long_name :
- Total Chlorophyll
- _ChunkSizes :
- [ 1 1 133 491]
Array Chunk Bytes 748.33 MB 748.33 MB Shape (31, 17, 723, 491) (31, 17, 723, 491) Count 2 Tasks 1 Chunks Type float32 numpy.ndarray - CO32(time, k, latitude, longitude)float32dask.array<chunksize=(31, 17, 723, 491), meta=np.ndarray>
- short_name :
- CO32
- units :
- mmol m-3
- long_name :
- Carbonate
- _ChunkSizes :
- [ 1 1 133 491]
Array Chunk Bytes 748.33 MB 748.33 MB Shape (31, 17, 723, 491) (31, 17, 723, 491) Count 2 Tasks 1 Chunks Type float32 numpy.ndarray - DIC(time, k, latitude, longitude)float32dask.array<chunksize=(31, 17, 723, 491), meta=np.ndarray>
- short_name :
- DIC
- units :
- mg C m-3
- long_name :
- Dissolved Inorganic Carbon
- _ChunkSizes :
- [ 1 1 133 491]
Array Chunk Bytes 748.33 MB 748.33 MB Shape (31, 17, 723, 491) (31, 17, 723, 491) Count 2 Tasks 1 Chunks Type float32 numpy.ndarray - DIN(time, k, latitude, longitude)float32dask.array<chunksize=(31, 17, 723, 491), meta=np.ndarray>
- short_name :
- DIN
- units :
- mg N m-3
- long_name :
- Dissolved Inorganic Nitrogen
- _ChunkSizes :
- [ 1 1 133 491]
Array Chunk Bytes 748.33 MB 748.33 MB Shape (31, 17, 723, 491) (31, 17, 723, 491) Count 2 Tasks 1 Chunks Type float32 numpy.ndarray - DIP(time, k, latitude, longitude)float32dask.array<chunksize=(31, 17, 723, 491), meta=np.ndarray>
- short_name :
- DIP
- units :
- mg P m-3
- long_name :
- Dissolved Inorganic Phosphorus
- _ChunkSizes :
- [ 1 1 133 491]
Array Chunk Bytes 748.33 MB 748.33 MB Shape (31, 17, 723, 491) (31, 17, 723, 491) Count 2 Tasks 1 Chunks Type float32 numpy.ndarray - DOR_C(time, k, latitude, longitude)float32dask.array<chunksize=(31, 17, 723, 491), meta=np.ndarray>
- short_name :
- DOR_C
- units :
- mg C m-3
- long_name :
- Dissolved Organic Carbon
- _ChunkSizes :
- [ 1 1 133 491]
Array Chunk Bytes 748.33 MB 748.33 MB Shape (31, 17, 723, 491) (31, 17, 723, 491) Count 2 Tasks 1 Chunks Type float32 numpy.ndarray - DOR_N(time, k, latitude, longitude)float32dask.array<chunksize=(31, 17, 723, 491), meta=np.ndarray>
- short_name :
- DOR_N
- units :
- mg N m-3
- long_name :
- Dissolved Organic Nitrogen
- _ChunkSizes :
- [ 1 1 133 491]
Array Chunk Bytes 748.33 MB 748.33 MB Shape (31, 17, 723, 491) (31, 17, 723, 491) Count 2 Tasks 1 Chunks Type float32 numpy.ndarray - DOR_P(time, k, latitude, longitude)float32dask.array<chunksize=(31, 17, 723, 491), meta=np.ndarray>
- short_name :
- DOR_P
- units :
- mg P m-3
- long_name :
- Dissolved Organic Phosphorus
- _ChunkSizes :
- [ 1 1 133 491]
Array Chunk Bytes 748.33 MB 748.33 MB Shape (31, 17, 723, 491) (31, 17, 723, 491) Count 2 Tasks 1 Chunks Type float32 numpy.ndarray - Dust(time, k, latitude, longitude)float32dask.array<chunksize=(31, 17, 723, 491), meta=np.ndarray>
- short_name :
- Dust
- units :
- kg m-3
- long_name :
- Dust
- _ChunkSizes :
- [ 1 1 133 491]
Array Chunk Bytes 748.33 MB 748.33 MB Shape (31, 17, 723, 491) (31, 17, 723, 491) Count 2 Tasks 1 Chunks Type float32 numpy.ndarray - EFI(time, k, latitude, longitude)float32dask.array<chunksize=(31, 17, 723, 491), meta=np.ndarray>
- short_name :
- EFI
- units :
- kg m-3
- long_name :
- Ecology Fine Inorganics
- _ChunkSizes :
- [ 1 1 133 491]
Array Chunk Bytes 748.33 MB 748.33 MB Shape (31, 17, 723, 491) (31, 17, 723, 491) Count 2 Tasks 1 Chunks Type float32 numpy.ndarray - FineSed(time, k, latitude, longitude)float32dask.array<chunksize=(31, 17, 723, 491), meta=np.ndarray>
- short_name :
- FineSed
- units :
- kg m-3
- long_name :
- FineSed
- _ChunkSizes :
- [ 1 1 133 491]
Array Chunk Bytes 748.33 MB 748.33 MB Shape (31, 17, 723, 491) (31, 17, 723, 491) Count 2 Tasks 1 Chunks Type float32 numpy.ndarray - Fluorescence(time, k, latitude, longitude)float32dask.array<chunksize=(31, 17, 723, 491), meta=np.ndarray>
- short_name :
- Fluorescence
- units :
- mg chla m-3
- long_name :
- Simulated Fluorescence
- _ChunkSizes :
- [ 1 1 133 491]
Array Chunk Bytes 748.33 MB 748.33 MB Shape (31, 17, 723, 491) (31, 17, 723, 491) Count 2 Tasks 1 Chunks Type float32 numpy.ndarray - HCO3(time, k, latitude, longitude)float32dask.array<chunksize=(31, 17, 723, 491), meta=np.ndarray>
- short_name :
- HCO3
- units :
- mmol m-3
- long_name :
- Bicarbonate
- _ChunkSizes :
- [ 1 1 133 491]
Array Chunk Bytes 748.33 MB 748.33 MB Shape (31, 17, 723, 491) (31, 17, 723, 491) Count 2 Tasks 1 Chunks Type float32 numpy.ndarray - Kd_490(time, k, latitude, longitude)float32dask.array<chunksize=(31, 17, 723, 491), meta=np.ndarray>
- short_name :
- Kd_490
- units :
- m-1
- long_name :
- Vert. att. at 490 nm
- _ChunkSizes :
- [ 1 1 133 491]
Array Chunk Bytes 748.33 MB 748.33 MB Shape (31, 17, 723, 491) (31, 17, 723, 491) Count 2 Tasks 1 Chunks Type float32 numpy.ndarray - MPB_Chl(time, k, latitude, longitude)float32dask.array<chunksize=(31, 17, 723, 491), meta=np.ndarray>
- short_name :
- MPB_Chl
- units :
- mg Chl m-3
- long_name :
- Microphytobenthos chlorophyll
- _ChunkSizes :
- [ 1 1 133 491]
Array Chunk Bytes 748.33 MB 748.33 MB Shape (31, 17, 723, 491) (31, 17, 723, 491) Count 2 Tasks 1 Chunks Type float32 numpy.ndarray - MPB_N(time, k, latitude, longitude)float32dask.array<chunksize=(31, 17, 723, 491), meta=np.ndarray>
- short_name :
- MPB_N
- units :
- mg N m-3
- long_name :
- Microphytobenthos N
- _ChunkSizes :
- [ 1 1 133 491]
Array Chunk Bytes 748.33 MB 748.33 MB Shape (31, 17, 723, 491) (31, 17, 723, 491) Count 2 Tasks 1 Chunks Type float32 numpy.ndarray - Mud-carbonate(time, k, latitude, longitude)float32dask.array<chunksize=(31, 17, 723, 491), meta=np.ndarray>
- short_name :
- Mud-carbonate
- units :
- kg m-3
- long_name :
- Mud-carbonate
- _ChunkSizes :
- [ 1 1 133 491]
Array Chunk Bytes 748.33 MB 748.33 MB Shape (31, 17, 723, 491) (31, 17, 723, 491) Count 2 Tasks 1 Chunks Type float32 numpy.ndarray - Mud-mineral(time, k, latitude, longitude)float32dask.array<chunksize=(31, 17, 723, 491), meta=np.ndarray>
- short_name :
- Mud-mineral
- units :
- kg m-3
- long_name :
- Mud-mineral
- _ChunkSizes :
- [ 1 1 133 491]
Array Chunk Bytes 748.33 MB 748.33 MB Shape (31, 17, 723, 491) (31, 17, 723, 491) Count 2 Tasks 1 Chunks Type float32 numpy.ndarray - Nfix(time, k, latitude, longitude)float32dask.array<chunksize=(31, 17, 723, 491), meta=np.ndarray>
- short_name :
- Nfix
- units :
- mg N m-3 s-1
- long_name :
- N2 fixation
- _ChunkSizes :
- [ 1 1 133 491]
Array Chunk Bytes 748.33 MB 748.33 MB Shape (31, 17, 723, 491) (31, 17, 723, 491) Count 2 Tasks 1 Chunks Type float32 numpy.ndarray - NH4(time, k, latitude, longitude)float32dask.array<chunksize=(31, 17, 723, 491), meta=np.ndarray>
- short_name :
- NH4
- units :
- mg N m-3
- long_name :
- Ammonia
- _ChunkSizes :
- [ 1 1 133 491]
Array Chunk Bytes 748.33 MB 748.33 MB Shape (31, 17, 723, 491) (31, 17, 723, 491) Count 2 Tasks 1 Chunks Type float32 numpy.ndarray - NO3(time, k, latitude, longitude)float32dask.array<chunksize=(31, 17, 723, 491), meta=np.ndarray>
- short_name :
- NO3
- units :
- mg N m-3
- long_name :
- Nitrate
- _ChunkSizes :
- [ 1 1 133 491]
Array Chunk Bytes 748.33 MB 748.33 MB Shape (31, 17, 723, 491) (31, 17, 723, 491) Count 2 Tasks 1 Chunks Type float32 numpy.ndarray - omega_ar(time, k, latitude, longitude)float32dask.array<chunksize=(31, 17, 723, 491), meta=np.ndarray>
- short_name :
- omega_ar
- units :
- nil
- long_name :
- Aragonite saturation state
- _ChunkSizes :
- [ 1 1 133 491]
Array Chunk Bytes 748.33 MB 748.33 MB Shape (31, 17, 723, 491) (31, 17, 723, 491) Count 2 Tasks 1 Chunks Type float32 numpy.ndarray - Oxy_sat(time, k, latitude, longitude)float32dask.array<chunksize=(31, 17, 723, 491), meta=np.ndarray>
- short_name :
- Oxy_sat
- units :
- %
- long_name :
- Oxygen saturation percent
- _ChunkSizes :
- [ 1 1 133 491]
Array Chunk Bytes 748.33 MB 748.33 MB Shape (31, 17, 723, 491) (31, 17, 723, 491) Count 2 Tasks 1 Chunks Type float32 numpy.ndarray - Oxygen(time, k, latitude, longitude)float32dask.array<chunksize=(31, 17, 723, 491), meta=np.ndarray>
- short_name :
- Oxygen
- units :
- mg O m-3
- long_name :
- Dissolved Oxygen
- _ChunkSizes :
- [ 1 1 133 491]
Array Chunk Bytes 748.33 MB 748.33 MB Shape (31, 17, 723, 491) (31, 17, 723, 491) Count 2 Tasks 1 Chunks Type float32 numpy.ndarray - P_Prod(time, k, latitude, longitude)float32dask.array<chunksize=(31, 17, 723, 491), meta=np.ndarray>
- short_name :
- P_Prod
- units :
- mg C m-3 d-1
- long_name :
- Phytoplankton total productivity
- _ChunkSizes :
- [ 1 1 133 491]
Array Chunk Bytes 748.33 MB 748.33 MB Shape (31, 17, 723, 491) (31, 17, 723, 491) Count 2 Tasks 1 Chunks Type float32 numpy.ndarray - PAR(time, k, latitude, longitude)float32dask.array<chunksize=(31, 17, 723, 491), meta=np.ndarray>
- short_name :
- PAR
- units :
- mol photon m-2 s-1
- long_name :
- Av. PAR in layer
- _ChunkSizes :
- [ 1 1 133 491]
Array Chunk Bytes 748.33 MB 748.33 MB Shape (31, 17, 723, 491) (31, 17, 723, 491) Count 2 Tasks 1 Chunks Type float32 numpy.ndarray - PAR_z(time, k, latitude, longitude)float32dask.array<chunksize=(31, 17, 723, 491), meta=np.ndarray>
- short_name :
- PAR_z
- units :
- mol photon m-2 s-1
- long_name :
- Downwelling PAR at top of layer
- _ChunkSizes :
- [ 1 1 133 491]
Array Chunk Bytes 748.33 MB 748.33 MB Shape (31, 17, 723, 491) (31, 17, 723, 491) Count 2 Tasks 1 Chunks Type float32 numpy.ndarray - pco2surf(time, k, latitude, longitude)float32dask.array<chunksize=(31, 17, 723, 491), meta=np.ndarray>
- short_name :
- pco2surf
- units :
- ppmv
- long_name :
- oceanic pCO2 (ppmv)
- _ChunkSizes :
- [ 1 1 133 491]
Array Chunk Bytes 748.33 MB 748.33 MB Shape (31, 17, 723, 491) (31, 17, 723, 491) Count 2 Tasks 1 Chunks Type float32 numpy.ndarray - PH(time, k, latitude, longitude)float32dask.array<chunksize=(31, 17, 723, 491), meta=np.ndarray>
- short_name :
- PH
- units :
- log(mM)
- long_name :
- PH
- _ChunkSizes :
- [ 1 1 133 491]
Array Chunk Bytes 748.33 MB 748.33 MB Shape (31, 17, 723, 491) (31, 17, 723, 491) Count 2 Tasks 1 Chunks Type float32 numpy.ndarray - PhyL_Chl(time, k, latitude, longitude)float32dask.array<chunksize=(31, 17, 723, 491), meta=np.ndarray>
- short_name :
- PhyL_Chl
- units :
- mg Chl m-3
- long_name :
- Large Phytoplankton chlorophyll
- _ChunkSizes :
- [ 1 1 133 491]
Array Chunk Bytes 748.33 MB 748.33 MB Shape (31, 17, 723, 491) (31, 17, 723, 491) Count 2 Tasks 1 Chunks Type float32 numpy.ndarray - PhyL_N(time, k, latitude, longitude)float32dask.array<chunksize=(31, 17, 723, 491), meta=np.ndarray>
- short_name :
- PhyL_N
- units :
- mg N m-3
- long_name :
- Large Phytoplankton N
- _ChunkSizes :
- [ 1 1 133 491]
Array Chunk Bytes 748.33 MB 748.33 MB Shape (31, 17, 723, 491) (31, 17, 723, 491) Count 2 Tasks 1 Chunks Type float32 numpy.ndarray - PhyS_Chl(time, k, latitude, longitude)float32dask.array<chunksize=(31, 17, 723, 491), meta=np.ndarray>
- short_name :
- PhyS_Chl
- units :
- mg Chl m-3
- long_name :
- Small Phytoplankton chlorophyll
- _ChunkSizes :
- [ 1 1 133 491]
Array Chunk Bytes 748.33 MB 748.33 MB Shape (31, 17, 723, 491) (31, 17, 723, 491) Count 2 Tasks 1 Chunks Type float32 numpy.ndarray - PhyS_N(time, k, latitude, longitude)float32dask.array<chunksize=(31, 17, 723, 491), meta=np.ndarray>
- short_name :
- PhyS_N
- units :
- mg N m-3
- long_name :
- Small Phytoplankton N
- _ChunkSizes :
- [ 1 1 133 491]
Array Chunk Bytes 748.33 MB 748.33 MB Shape (31, 17, 723, 491) (31, 17, 723, 491) Count 2 Tasks 1 Chunks Type float32 numpy.ndarray - PhyS_NR(time, k, latitude, longitude)float32dask.array<chunksize=(31, 17, 723, 491), meta=np.ndarray>
- short_name :
- PhyS_NR
- units :
- mg N m-3
- long_name :
- Small Phytoplankton N reserve
- _ChunkSizes :
- [ 1 1 133 491]
Array Chunk Bytes 748.33 MB 748.33 MB Shape (31, 17, 723, 491) (31, 17, 723, 491) Count 2 Tasks 1 Chunks Type float32 numpy.ndarray - PIP(time, k, latitude, longitude)float32dask.array<chunksize=(31, 17, 723, 491), meta=np.ndarray>
- short_name :
- PIP
- units :
- mg P m-3
- long_name :
- Particulate Inorganic Phosphorus
- _ChunkSizes :
- [ 1 1 133 491]
Array Chunk Bytes 748.33 MB 748.33 MB Shape (31, 17, 723, 491) (31, 17, 723, 491) Count 2 Tasks 1 Chunks Type float32 numpy.ndarray - salt(time, k, latitude, longitude)float32dask.array<chunksize=(31, 17, 723, 491), meta=np.ndarray>
- short_name :
- salt
- units :
- PSU
- long_name :
- Salinity
- _ChunkSizes :
- [ 1 1 133 491]
Array Chunk Bytes 748.33 MB 748.33 MB Shape (31, 17, 723, 491) (31, 17, 723, 491) Count 2 Tasks 1 Chunks Type float32 numpy.ndarray - TC(time, k, latitude, longitude)float32dask.array<chunksize=(31, 17, 723, 491), meta=np.ndarray>
- short_name :
- TC
- units :
- mg C m-3
- long_name :
- Total C
- _ChunkSizes :
- [ 1 1 133 491]
Array Chunk Bytes 748.33 MB 748.33 MB Shape (31, 17, 723, 491) (31, 17, 723, 491) Count 2 Tasks 1 Chunks Type float32 numpy.ndarray - temp(time, k, latitude, longitude)float32dask.array<chunksize=(31, 17, 723, 491), meta=np.ndarray>
- short_name :
- temp
- units :
- degrees C
- long_name :
- Temperature
- _ChunkSizes :
- [ 1 1 133 491]
Array Chunk Bytes 748.33 MB 748.33 MB Shape (31, 17, 723, 491) (31, 17, 723, 491) Count 2 Tasks 1 Chunks Type float32 numpy.ndarray - TN(time, k, latitude, longitude)float32dask.array<chunksize=(31, 17, 723, 491), meta=np.ndarray>
- short_name :
- TN
- units :
- mg N m-3
- long_name :
- Total N
- _ChunkSizes :
- [ 1 1 133 491]
Array Chunk Bytes 748.33 MB 748.33 MB Shape (31, 17, 723, 491) (31, 17, 723, 491) Count 2 Tasks 1 Chunks Type float32 numpy.ndarray - TP(time, k, latitude, longitude)float32dask.array<chunksize=(31, 17, 723, 491), meta=np.ndarray>
- short_name :
- TP
- units :
- mg P m-3
- long_name :
- Total P
- _ChunkSizes :
- [ 1 1 133 491]
Array Chunk Bytes 748.33 MB 748.33 MB Shape (31, 17, 723, 491) (31, 17, 723, 491) Count 2 Tasks 1 Chunks Type float32 numpy.ndarray - Tricho_Chl(time, k, latitude, longitude)float32dask.array<chunksize=(31, 17, 723, 491), meta=np.ndarray>
- short_name :
- Tricho_Chl
- units :
- mg Chl m-3
- long_name :
- Trichodesmium chlorophyll
- _ChunkSizes :
- [ 1 1 133 491]
Array Chunk Bytes 748.33 MB 748.33 MB Shape (31, 17, 723, 491) (31, 17, 723, 491) Count 2 Tasks 1 Chunks Type float32 numpy.ndarray - Tricho_N(time, k, latitude, longitude)float32dask.array<chunksize=(31, 17, 723, 491), meta=np.ndarray>
- short_name :
- Tricho_N
- units :
- mg N m-3
- long_name :
- Trichodesmium Nitrogen
- _ChunkSizes :
- [ 1 1 133 491]
Array Chunk Bytes 748.33 MB 748.33 MB Shape (31, 17, 723, 491) (31, 17, 723, 491) Count 2 Tasks 1 Chunks Type float32 numpy.ndarray - Z_grazing(time, k, latitude, longitude)float32dask.array<chunksize=(31, 17, 723, 491), meta=np.ndarray>
- short_name :
- Z_grazing
- units :
- mg C m-3 d-1
- long_name :
- Zooplankton total grazing
- _ChunkSizes :
- [ 1 1 133 491]
Array Chunk Bytes 748.33 MB 748.33 MB Shape (31, 17, 723, 491) (31, 17, 723, 491) Count 2 Tasks 1 Chunks Type float32 numpy.ndarray - ZooL_N(time, k, latitude, longitude)float32dask.array<chunksize=(31, 17, 723, 491), meta=np.ndarray>
- short_name :
- ZooL_N
- units :
- mg N m-3
- long_name :
- Large Zooplankton N
- _ChunkSizes :
- [ 1 1 133 491]
Array Chunk Bytes 748.33 MB 748.33 MB Shape (31, 17, 723, 491) (31, 17, 723, 491) Count 2 Tasks 1 Chunks Type float32 numpy.ndarray - ZooS_N(time, k, latitude, longitude)float32dask.array<chunksize=(31, 17, 723, 491), meta=np.ndarray>
- short_name :
- ZooS_N
- units :
- mg N m-3
- long_name :
- Small Zooplankton N
- _ChunkSizes :
- [ 1 1 133 491]
Array Chunk Bytes 748.33 MB 748.33 MB Shape (31, 17, 723, 491) (31, 17, 723, 491) Count 2 Tasks 1 Chunks Type float32 numpy.ndarray - CH_N(time, latitude, longitude)float32dask.array<chunksize=(31, 723, 491), meta=np.ndarray>
- short_name :
- CH_N
- units :
- g N m-2
- long_name :
- Coral host N
- _ChunkSizes :
- [ 1 133 491]
Array Chunk Bytes 44.02 MB 44.02 MB Shape (31, 723, 491) (31, 723, 491) Count 2 Tasks 1 Chunks Type float32 numpy.ndarray - CS_bleach(time, latitude, longitude)float32dask.array<chunksize=(31, 723, 491), meta=np.ndarray>
- short_name :
- CS_bleach
- units :
- d-1
- long_name :
- Coral bleach rate
- _ChunkSizes :
- [ 1 133 491]
Array Chunk Bytes 44.02 MB 44.02 MB Shape (31, 723, 491) (31, 723, 491) Count 2 Tasks 1 Chunks Type float32 numpy.ndarray - CS_Chl(time, latitude, longitude)float32dask.array<chunksize=(31, 723, 491), meta=np.ndarray>
- short_name :
- CS_Chl
- units :
- mg Chl m-2
- long_name :
- Coral symbiont Chl
- _ChunkSizes :
- [ 1 133 491]
Array Chunk Bytes 44.02 MB 44.02 MB Shape (31, 723, 491) (31, 723, 491) Count 2 Tasks 1 Chunks Type float32 numpy.ndarray - CS_N(time, latitude, longitude)float32dask.array<chunksize=(31, 723, 491), meta=np.ndarray>
- short_name :
- CS_N
- units :
- mg N m-2
- long_name :
- Coral symbiont N
- _ChunkSizes :
- [ 1 133 491]
Array Chunk Bytes 44.02 MB 44.02 MB Shape (31, 723, 491) (31, 723, 491) Count 2 Tasks 1 Chunks Type float32 numpy.ndarray - EpiPAR_sg(time, latitude, longitude)float32dask.array<chunksize=(31, 723, 491), meta=np.ndarray>
- short_name :
- EpiPAR_sg
- units :
- mol photon m-2 d-1
- long_name :
- Light intensity above seagrass
- _ChunkSizes :
- [ 1 133 491]
Array Chunk Bytes 44.02 MB 44.02 MB Shape (31, 723, 491) (31, 723, 491) Count 2 Tasks 1 Chunks Type float32 numpy.ndarray - eta(time, latitude, longitude)float32dask.array<chunksize=(31, 723, 491), meta=np.ndarray>
- short_name :
- eta
- units :
- metre
- long_name :
- Surface Elevation
- _ChunkSizes :
- [ 1 133 491]
Array Chunk Bytes 44.02 MB 44.02 MB Shape (31, 723, 491) (31, 723, 491) Count 2 Tasks 1 Chunks Type float32 numpy.ndarray - MA_N(time, latitude, longitude)float32dask.array<chunksize=(31, 723, 491), meta=np.ndarray>
- short_name :
- MA_N
- units :
- g N m-2
- long_name :
- Macroalgae N
- _ChunkSizes :
- [ 1 133 491]
Array Chunk Bytes 44.02 MB 44.02 MB Shape (31, 723, 491) (31, 723, 491) Count 2 Tasks 1 Chunks Type float32 numpy.ndarray - MA_N_pr(time, latitude, longitude)float32dask.array<chunksize=(31, 723, 491), meta=np.ndarray>
- short_name :
- MA_N_pr
- units :
- mg N m-2 d-1
- long_name :
- Macroalgae net production
- _ChunkSizes :
- [ 1 133 491]
Array Chunk Bytes 44.02 MB 44.02 MB Shape (31, 723, 491) (31, 723, 491) Count 2 Tasks 1 Chunks Type float32 numpy.ndarray - month_EpiPAR_sg(time, latitude, longitude)float32dask.array<chunksize=(31, 723, 491), meta=np.ndarray>
- short_name :
- month_EpiPAR_sg
- units :
- mol photon m-2
- long_name :
- Monthly dose light above seagrass
- _ChunkSizes :
- [ 1 133 491]
Array Chunk Bytes 44.02 MB 44.02 MB Shape (31, 723, 491) (31, 723, 491) Count 2 Tasks 1 Chunks Type float32 numpy.ndarray - R_400(time, latitude, longitude)float32dask.array<chunksize=(31, 723, 491), meta=np.ndarray>
- short_name :
- R_400
- units :
- sr-1
- long_name :
- Remote-sensing reflectance @ 400 nm
- _ChunkSizes :
- [ 1 133 491]
Array Chunk Bytes 44.02 MB 44.02 MB Shape (31, 723, 491) (31, 723, 491) Count 2 Tasks 1 Chunks Type float32 numpy.ndarray - R_410(time, latitude, longitude)float32dask.array<chunksize=(31, 723, 491), meta=np.ndarray>
- short_name :
- R_410
- units :
- sr-1
- long_name :
- Remote-sensing reflectance @ 410 nm
- _ChunkSizes :
- [ 1 133 491]
Array Chunk Bytes 44.02 MB 44.02 MB Shape (31, 723, 491) (31, 723, 491) Count 2 Tasks 1 Chunks Type float32 numpy.ndarray - R_412(time, latitude, longitude)float32dask.array<chunksize=(31, 723, 491), meta=np.ndarray>
- short_name :
- R_412
- units :
- sr-1
- long_name :
- Remote-sensing reflectance @ 412 nm
- _ChunkSizes :
- [ 1 133 491]
Array Chunk Bytes 44.02 MB 44.02 MB Shape (31, 723, 491) (31, 723, 491) Count 2 Tasks 1 Chunks Type float32 numpy.ndarray - R_443(time, latitude, longitude)float32dask.array<chunksize=(31, 723, 491), meta=np.ndarray>
- short_name :
- R_443
- units :
- sr-1
- long_name :
- Remote-sensing reflectance @ 443 nm
- _ChunkSizes :
- [ 1 133 491]
Array Chunk Bytes 44.02 MB 44.02 MB Shape (31, 723, 491) (31, 723, 491) Count 2 Tasks 1 Chunks Type float32 numpy.ndarray - R_470(time, latitude, longitude)float32dask.array<chunksize=(31, 723, 491), meta=np.ndarray>
- short_name :
- R_470
- units :
- sr-1
- long_name :
- Remote-sensing reflectance @ 470 nm
- _ChunkSizes :
- [ 1 133 491]
Array Chunk Bytes 44.02 MB 44.02 MB Shape (31, 723, 491) (31, 723, 491) Count 2 Tasks 1 Chunks Type float32 numpy.ndarray - R_486(time, latitude, longitude)float32dask.array<chunksize=(31, 723, 491), meta=np.ndarray>
- short_name :
- R_486
- units :
- sr-1
- long_name :
- Remote-sensing reflectance @ 486 nm
- _ChunkSizes :
- [ 1 133 491]
Array Chunk Bytes 44.02 MB 44.02 MB Shape (31, 723, 491) (31, 723, 491) Count 2 Tasks 1 Chunks Type float32 numpy.ndarray - R_488(time, latitude, longitude)float32dask.array<chunksize=(31, 723, 491), meta=np.ndarray>
- short_name :
- R_488
- units :
- sr-1
- long_name :
- Remote-sensing reflectance @ 488 nm
- _ChunkSizes :
- [ 1 133 491]
Array Chunk Bytes 44.02 MB 44.02 MB Shape (31, 723, 491) (31, 723, 491) Count 2 Tasks 1 Chunks Type float32 numpy.ndarray - R_490(time, latitude, longitude)float32dask.array<chunksize=(31, 723, 491), meta=np.ndarray>
- short_name :
- R_490
- units :
- sr-1
- long_name :
- Remote-sensing reflectance @ 490 nm
- _ChunkSizes :
- [ 1 133 491]
Array Chunk Bytes 44.02 MB 44.02 MB Shape (31, 723, 491) (31, 723, 491) Count 2 Tasks 1 Chunks Type float32 numpy.ndarray - R_510(time, latitude, longitude)float32dask.array<chunksize=(31, 723, 491), meta=np.ndarray>
- short_name :
- R_510
- units :
- sr-1
- long_name :
- Remote-sensing reflectance @ 510 nm
- _ChunkSizes :
- [ 1 133 491]
Array Chunk Bytes 44.02 MB 44.02 MB Shape (31, 723, 491) (31, 723, 491) Count 2 Tasks 1 Chunks Type float32 numpy.ndarray - R_531(time, latitude, longitude)float32dask.array<chunksize=(31, 723, 491), meta=np.ndarray>
- short_name :
- R_531
- units :
- sr-1
- long_name :
- Remote-sensing reflectance @ 531 nm
- _ChunkSizes :
- [ 1 133 491]
Array Chunk Bytes 44.02 MB 44.02 MB Shape (31, 723, 491) (31, 723, 491) Count 2 Tasks 1 Chunks Type float32 numpy.ndarray - R_547(time, latitude, longitude)float32dask.array<chunksize=(31, 723, 491), meta=np.ndarray>
- short_name :
- R_547
- units :
- sr-1
- long_name :
- Remote-sensing reflectance @ 547 nm
- _ChunkSizes :
- [ 1 133 491]
Array Chunk Bytes 44.02 MB 44.02 MB Shape (31, 723, 491) (31, 723, 491) Count 2 Tasks 1 Chunks Type float32 numpy.ndarray - R_551(time, latitude, longitude)float32dask.array<chunksize=(31, 723, 491), meta=np.ndarray>
- short_name :
- R_551
- units :
- sr-1
- long_name :
- Remote-sensing reflectance @ 551 nm
- _ChunkSizes :
- [ 1 133 491]
Array Chunk Bytes 44.02 MB 44.02 MB Shape (31, 723, 491) (31, 723, 491) Count 2 Tasks 1 Chunks Type float32 numpy.ndarray - R_555(time, latitude, longitude)float32dask.array<chunksize=(31, 723, 491), meta=np.ndarray>
- short_name :
- R_555
- units :
- sr-1
- long_name :
- Remote-sensing reflectance @ 555 nm
- _ChunkSizes :
- [ 1 133 491]
Array Chunk Bytes 44.02 MB 44.02 MB Shape (31, 723, 491) (31, 723, 491) Count 2 Tasks 1 Chunks Type float32 numpy.ndarray - R_560(time, latitude, longitude)float32dask.array<chunksize=(31, 723, 491), meta=np.ndarray>
- short_name :
- R_560
- units :
- sr-1
- long_name :
- Remote-sensing reflectance @ 560 nm
- _ChunkSizes :
- [ 1 133 491]
Array Chunk Bytes 44.02 MB 44.02 MB Shape (31, 723, 491) (31, 723, 491) Count 2 Tasks 1 Chunks Type float32 numpy.ndarray - R_590(time, latitude, longitude)float32dask.array<chunksize=(31, 723, 491), meta=np.ndarray>
- short_name :
- R_590
- units :
- sr-1
- long_name :
- Remote-sensing reflectance @ 590 nm
- _ChunkSizes :
- [ 1 133 491]
Array Chunk Bytes 44.02 MB 44.02 MB Shape (31, 723, 491) (31, 723, 491) Count 2 Tasks 1 Chunks Type float32 numpy.ndarray - R_620(time, latitude, longitude)float32dask.array<chunksize=(31, 723, 491), meta=np.ndarray>
- short_name :
- R_620
- units :
- sr-1
- long_name :
- Remote-sensing reflectance @ 620 nm
- _ChunkSizes :
- [ 1 133 491]
Array Chunk Bytes 44.02 MB 44.02 MB Shape (31, 723, 491) (31, 723, 491) Count 2 Tasks 1 Chunks Type float32 numpy.ndarray - R_640(time, latitude, longitude)float32dask.array<chunksize=(31, 723, 491), meta=np.ndarray>
- short_name :
- R_640
- units :
- sr-1
- long_name :
- Remote-sensing reflectance @ 640 nm
- _ChunkSizes :
- [ 1 133 491]
Array Chunk Bytes 44.02 MB 44.02 MB Shape (31, 723, 491) (31, 723, 491) Count 2 Tasks 1 Chunks Type float32 numpy.ndarray - R_645(time, latitude, longitude)float32dask.array<chunksize=(31, 723, 491), meta=np.ndarray>
- short_name :
- R_645
- units :
- sr-1
- long_name :
- Remote-sensing reflectance @ 645 nm
- _ChunkSizes :
- [ 1 133 491]
Array Chunk Bytes 44.02 MB 44.02 MB Shape (31, 723, 491) (31, 723, 491) Count 2 Tasks 1 Chunks Type float32 numpy.ndarray - R_665(time, latitude, longitude)float32dask.array<chunksize=(31, 723, 491), meta=np.ndarray>
- short_name :
- R_665
- units :
- sr-1
- long_name :
- Remote-sensing reflectance @ 665 nm
- _ChunkSizes :
- [ 1 133 491]
Array Chunk Bytes 44.02 MB 44.02 MB Shape (31, 723, 491) (31, 723, 491) Count 2 Tasks 1 Chunks Type float32 numpy.ndarray - R_667(time, latitude, longitude)float32dask.array<chunksize=(31, 723, 491), meta=np.ndarray>
- short_name :
- R_667
- units :
- sr-1
- long_name :
- Remote-sensing reflectance @ 667 nm
- _ChunkSizes :
- [ 1 133 491]
Array Chunk Bytes 44.02 MB 44.02 MB Shape (31, 723, 491) (31, 723, 491) Count 2 Tasks 1 Chunks Type float32 numpy.ndarray - R_671(time, latitude, longitude)float32dask.array<chunksize=(31, 723, 491), meta=np.ndarray>
- short_name :
- R_671
- units :
- sr-1
- long_name :
- Remote-sensing reflectance @ 671 nm
- _ChunkSizes :
- [ 1 133 491]
Array Chunk Bytes 44.02 MB 44.02 MB Shape (31, 723, 491) (31, 723, 491) Count 2 Tasks 1 Chunks Type float32 numpy.ndarray - R_673(time, latitude, longitude)float32dask.array<chunksize=(31, 723, 491), meta=np.ndarray>
- short_name :
- R_673
- units :
- sr-1
- long_name :
- Remote-sensing reflectance @ 673 nm
- _ChunkSizes :
- [ 1 133 491]
Array Chunk Bytes 44.02 MB 44.02 MB Shape (31, 723, 491) (31, 723, 491) Count 2 Tasks 1 Chunks Type float32 numpy.ndarray - R_678(time, latitude, longitude)float32dask.array<chunksize=(31, 723, 491), meta=np.ndarray>
- short_name :
- R_678
- units :
- sr-1
- long_name :
- Remote-sensing reflectance @ 678 nm
- _ChunkSizes :
- [ 1 133 491]
Array Chunk Bytes 44.02 MB 44.02 MB Shape (31, 723, 491) (31, 723, 491) Count 2 Tasks 1 Chunks Type float32 numpy.ndarray - R_681(time, latitude, longitude)float32dask.array<chunksize=(31, 723, 491), meta=np.ndarray>
- short_name :
- R_681
- units :
- sr-1
- long_name :
- Remote-sensing reflectance @ 681 nm
- _ChunkSizes :
- [ 1 133 491]
Array Chunk Bytes 44.02 MB 44.02 MB Shape (31, 723, 491) (31, 723, 491) Count 2 Tasks 1 Chunks Type float32 numpy.ndarray - R_709(time, latitude, longitude)float32dask.array<chunksize=(31, 723, 491), meta=np.ndarray>
- short_name :
- R_709
- units :
- sr-1
- long_name :
- Remote-sensing reflectance @ 709 nm
- _ChunkSizes :
- [ 1 133 491]
Array Chunk Bytes 44.02 MB 44.02 MB Shape (31, 723, 491) (31, 723, 491) Count 2 Tasks 1 Chunks Type float32 numpy.ndarray - R_745(time, latitude, longitude)float32dask.array<chunksize=(31, 723, 491), meta=np.ndarray>
- short_name :
- R_745
- units :
- sr-1
- long_name :
- Remote-sensing reflectance @ 745 nm
- _ChunkSizes :
- [ 1 133 491]
Array Chunk Bytes 44.02 MB 44.02 MB Shape (31, 723, 491) (31, 723, 491) Count 2 Tasks 1 Chunks Type float32 numpy.ndarray - R_748(time, latitude, longitude)float32dask.array<chunksize=(31, 723, 491), meta=np.ndarray>
- short_name :
- R_748
- units :
- sr-1
- long_name :
- Remote-sensing reflectance @ 748 nm
- _ChunkSizes :
- [ 1 133 491]
Array Chunk Bytes 44.02 MB 44.02 MB Shape (31, 723, 491) (31, 723, 491) Count 2 Tasks 1 Chunks Type float32 numpy.ndarray - R_754(time, latitude, longitude)float32dask.array<chunksize=(31, 723, 491), meta=np.ndarray>
- short_name :
- R_754
- units :
- sr-1
- long_name :
- Remote-sensing reflectance @ 754 nm
- _ChunkSizes :
- [ 1 133 491]
Array Chunk Bytes 44.02 MB 44.02 MB Shape (31, 723, 491) (31, 723, 491) Count 2 Tasks 1 Chunks Type float32 numpy.ndarray - R_761(time, latitude, longitude)float32dask.array<chunksize=(31, 723, 491), meta=np.ndarray>
- short_name :
- R_761
- units :
- sr-1
- long_name :
- Remote-sensing reflectance @ 761 nm
- _ChunkSizes :
- [ 1 133 491]
Array Chunk Bytes 44.02 MB 44.02 MB Shape (31, 723, 491) (31, 723, 491) Count 2 Tasks 1 Chunks Type float32 numpy.ndarray - R_764(time, latitude, longitude)float32dask.array<chunksize=(31, 723, 491), meta=np.ndarray>
- short_name :
- R_764
- units :
- sr-1
- long_name :
- Remote-sensing reflectance @ 764 nm
- _ChunkSizes :
- [ 1 133 491]
Array Chunk Bytes 44.02 MB 44.02 MB Shape (31, 723, 491) (31, 723, 491) Count 2 Tasks 1 Chunks Type float32 numpy.ndarray - R_767(time, latitude, longitude)float32dask.array<chunksize=(31, 723, 491), meta=np.ndarray>
- short_name :
- R_767
- units :
- sr-1
- long_name :
- Remote-sensing reflectance @ 767 nm
- _ChunkSizes :
- [ 1 133 491]
Array Chunk Bytes 44.02 MB 44.02 MB Shape (31, 723, 491) (31, 723, 491) Count 2 Tasks 1 Chunks Type float32 numpy.ndarray - R_778(time, latitude, longitude)float32dask.array<chunksize=(31, 723, 491), meta=np.ndarray>
- short_name :
- R_778
- units :
- sr-1
- long_name :
- Remote-sensing reflectance @ 778 nm
- _ChunkSizes :
- [ 1 133 491]
Array Chunk Bytes 44.02 MB 44.02 MB Shape (31, 723, 491) (31, 723, 491) Count 2 Tasks 1 Chunks Type float32 numpy.ndarray - Secchi(time, latitude, longitude)float32dask.array<chunksize=(31, 723, 491), meta=np.ndarray>
- short_name :
- Secchi
- units :
- m
- long_name :
- Secchi from 488 nm
- _ChunkSizes :
- [ 1 133 491]
Array Chunk Bytes 44.02 MB 44.02 MB Shape (31, 723, 491) (31, 723, 491) Count 2 Tasks 1 Chunks Type float32 numpy.ndarray - SG_N(time, latitude, longitude)float32dask.array<chunksize=(31, 723, 491), meta=np.ndarray>
- short_name :
- SG_N
- units :
- g N m-2
- long_name :
- Seagrass N
- _ChunkSizes :
- [ 1 133 491]
Array Chunk Bytes 44.02 MB 44.02 MB Shape (31, 723, 491) (31, 723, 491) Count 2 Tasks 1 Chunks Type float32 numpy.ndarray - SG_N_pr(time, latitude, longitude)float32dask.array<chunksize=(31, 723, 491), meta=np.ndarray>
- short_name :
- SG_N_pr
- units :
- mg N m-2 d-1
- long_name :
- Seagrass net production
- _ChunkSizes :
- [ 1 133 491]
Array Chunk Bytes 44.02 MB 44.02 MB Shape (31, 723, 491) (31, 723, 491) Count 2 Tasks 1 Chunks Type float32 numpy.ndarray - SG_shear_mort(time, latitude, longitude)float32dask.array<chunksize=(31, 723, 491), meta=np.ndarray>
- short_name :
- SG_shear_mort
- units :
- g N m-2 d-1
- long_name :
- Seagrass shear stress mort
- _ChunkSizes :
- [ 1 133 491]
Array Chunk Bytes 44.02 MB 44.02 MB Shape (31, 723, 491) (31, 723, 491) Count 2 Tasks 1 Chunks Type float32 numpy.ndarray - SGD_N(time, latitude, longitude)float32dask.array<chunksize=(31, 723, 491), meta=np.ndarray>
- short_name :
- SGD_N
- units :
- g N m-2
- long_name :
- Deep seagrass N
- _ChunkSizes :
- [ 1 133 491]
Array Chunk Bytes 44.02 MB 44.02 MB Shape (31, 723, 491) (31, 723, 491) Count 2 Tasks 1 Chunks Type float32 numpy.ndarray - SGD_N_pr(time, latitude, longitude)float32dask.array<chunksize=(31, 723, 491), meta=np.ndarray>
- short_name :
- SGD_N_pr
- units :
- mg N m-2 d-1
- long_name :
- Deep seagrass net production
- _ChunkSizes :
- [ 1 133 491]
Array Chunk Bytes 44.02 MB 44.02 MB Shape (31, 723, 491) (31, 723, 491) Count 2 Tasks 1 Chunks Type float32 numpy.ndarray - SGD_shear_mort(time, latitude, longitude)float32dask.array<chunksize=(31, 723, 491), meta=np.ndarray>
- short_name :
- SGD_shear_mort
- units :
- g N m-2 d-1
- long_name :
- Deep seagrass shear stress mort
- _ChunkSizes :
- [ 1 133 491]
Array Chunk Bytes 44.02 MB 44.02 MB Shape (31, 723, 491) (31, 723, 491) Count 2 Tasks 1 Chunks Type float32 numpy.ndarray - SGH_N(time, latitude, longitude)float32dask.array<chunksize=(31, 723, 491), meta=np.ndarray>
- short_name :
- SGH_N
- units :
- g N m-2
- long_name :
- Halophila N
- _ChunkSizes :
- [ 1 133 491]
Array Chunk Bytes 44.02 MB 44.02 MB Shape (31, 723, 491) (31, 723, 491) Count 2 Tasks 1 Chunks Type float32 numpy.ndarray - SGH_N_pr(time, latitude, longitude)float32dask.array<chunksize=(31, 723, 491), meta=np.ndarray>
- short_name :
- SGH_N_pr
- units :
- mg N m-2 d-1
- long_name :
- Halophila net production
- _ChunkSizes :
- [ 1 133 491]
Array Chunk Bytes 44.02 MB 44.02 MB Shape (31, 723, 491) (31, 723, 491) Count 2 Tasks 1 Chunks Type float32 numpy.ndarray - SGHROOT_N(time, latitude, longitude)float32dask.array<chunksize=(31, 723, 491), meta=np.ndarray>
- short_name :
- SGHROOT_N
- units :
- g N m-2
- long_name :
- Halophila root N
- _ChunkSizes :
- [ 1 133 491]
Array Chunk Bytes 44.02 MB 44.02 MB Shape (31, 723, 491) (31, 723, 491) Count 2 Tasks 1 Chunks Type float32 numpy.ndarray - SGROOT_N(time, latitude, longitude)float32dask.array<chunksize=(31, 723, 491), meta=np.ndarray>
- short_name :
- SGROOT_N
- units :
- g N m-2
- long_name :
- Seagrass root N
- _ChunkSizes :
- [ 1 133 491]
Array Chunk Bytes 44.02 MB 44.02 MB Shape (31, 723, 491) (31, 723, 491) Count 2 Tasks 1 Chunks Type float32 numpy.ndarray - TSSM(time, latitude, longitude)float32dask.array<chunksize=(31, 723, 491), meta=np.ndarray>
- short_name :
- TSSM
- units :
- g TSS m-3
- long_name :
- TSS from 645 nm (Petus et al., 2014)
- _ChunkSizes :
- [ 1 133 491]
Array Chunk Bytes 44.02 MB 44.02 MB Shape (31, 723, 491) (31, 723, 491) Count 2 Tasks 1 Chunks Type float32 numpy.ndarray - Zenith2D(time, latitude, longitude)float32dask.array<chunksize=(31, 723, 491), meta=np.ndarray>
- short_name :
- Zenith2D
- units :
- rad
- long_name :
- Solar zenith
- _ChunkSizes :
- [ 1 133 491]
Array Chunk Bytes 44.02 MB 44.02 MB Shape (31, 723, 491) (31, 723, 491) Count 2 Tasks 1 Chunks Type float32 numpy.ndarray
- Conventions :
- CF-1.0
- NCO :
- netCDF Operators version 4.7.7 (Homepage = http://nco.sf.net, Code = http://github.com/nco/nco)
- RunID :
- 2
- _CoordSysBuilder :
- ucar.nc2.dataset.conv.CF1Convention
- aims_ncaggregate_buildDate :
- 2020-08-21T23:07:30+10:00
- aims_ncaggregate_datasetId :
- products__ncaggregate__ereefs__GBR4_H2p0_B3p1_Cq3b_Dhnd__daily-monthly/EREEFS_AIMS-CSIRO_GBR4_H2p0_B3p1_Cq3b_Dhnd_bgc_daily-monthly-2018-01
- aims_ncaggregate_firstDate :
- 2018-01-01T12:00:00+10:00
- aims_ncaggregate_inputs :
- [products__ncaggregate__ereefs__GBR4_H2p0_B3p1_Cq3b_Dhnd__raw/EREEFS_AIMS-CSIRO_GBR4_H2p0_B3p1_Cq3b_Dhnd_bgc_raw_2018-01::MD5:922cfd031369e604eab88561e411dc0e]
- aims_ncaggregate_lastDate :
- 2018-01-31T12:00:00+10:00
- codehead :
- CSIRO Environmental Modelling Suite
- description :
- Regridding of daily input data (from eReefs AIMS-CSIRO GBR4 BioGeoChemical 3.1 subset) from curvilinear (per input data) to rectilinear via inverse weighted distance from up to 4 closest cells.
- ems_version :
- v1.1.1 rev(6244M)
- history :
- Tue Oct 8 15:38:27 2019: ncatted -a positive,botz,o,char,up -a missing_value,botz,o,double,99. -a outside,botz,o,double,-9999. gbr4_bgc_all_simple_2018-01.nc 2020-08-20T23:45:30+10:00: vendor: AIMS; processing: None summaries 2020-08-21T23:07:30+10:00: vendor: AIMS; processing: None summaries
- metadata_link :
- https://eatlas.org.au/data/uuid/61f3a6df-2c4a-46b6-ab62-3f3a9bf4e87a
- paramfile :
- /home/bai155/EMS_solar2/gbr4_H2p0_B3p1_Cb/tran/GBR4_H2p0_B3p1_Cq3b_Dhnd.tran
- paramhead :
- eReefs 4 km grid. SOURCE Catchments with 2019 condition from Dec 1, 2010 to June,30, 2018, Empirical SOURCE with 2019 condition, Jul 1, 2018 to April 30, 2019. More details of naming protocol at: eReefs.info.
- technical_guide_link :
- https://eatlas.org.au/pydio/public/aims-ereefs-platform-technical-guide-to-derived-products-from-csiro-ereefs-models-pdf
- technical_guide_publish_date :
- 2020-08-18
- title :
- eReefs AIMS-CSIRO GBR4 BioGeoChemical 3.1 (baseline catchment conditions) daily aggregation
- DODS_EXTRA.Unlimited_Dimension :
- time
Simple dashboard
We will use the quadmesh function to quickly rasterize the output to the requested width and height and to create a simple dashboard for interactive, dynamic visualization of eReefs data.
Note
Using the controls on the right, the user can select the pan and wheel_zoom, which enables dynamic exploration of the temperature value in the GBR.
Zooming into the GBR on the eReefs modelled temperature, using the pan and wheel zoom controls.
Tip
By selecting the hover control it allows data values to be displayed along with their coordinates.
var = 'temp'
base_map = gvts.EsriImagery # ESRI satellite image as background
# Get title from dataset variables attributes
label = f'{ds_bio[var].long_name}: {ds_bio[var].units}'
# Build the quadmesh
mesh = ds_bio[var][:,:].hvplot.quadmesh(x='longitude',y='latitude',
crs=ccrs.PlateCarree(), cmap='jet',
rasterize=True, groupby=list(ds_bio[var].dims[:2]),
title=label, width=600,height=600)
overlay = (base_map * mesh).opts(active_tools=['wheel_zoom', 'pan'])
# Define the slider as panel widgets
widgets = {dim: pn.widgets.Select for dim in ds_bio[var].dims[:2]}
# Combine everything in a dashboard
dashboard = pn.pane.HoloViews(overlay, widgets=widgets).layout
dashboard
Adding Dashboard functionalities
At this point we have learned how to build interactive apps and dashboards with Panel, how to quickly build visualizations with hvPlot, and add custom interactivity by using HoloViews.
We will now work on putting all of this together to build a more complex, and efficient data processing pipelines, controlled by Panel widgets.
Defining panel widgets
# Define the existing variables in the xArray Dataset
rho_vars = []
for var in ds_bio.data_vars:
if len(ds_bio[var].dims) > 0:
rho_vars.append(var)
# Define the panel widget for the Xarray variables
var_select = pn.widgets.Select(name='Select variables:', options=rho_vars,
value='temp')
# Define the panel widget for the background maps
base_map_select = pn.widgets.Select(name='Choose underlying map:',
options=gvts.tile_sources,
value=gvts.EsriImagery)
# Define the panel widget for the different colormap
color_select = pn.widgets.Select(name='Pick a colormap', options= sorted([
'cet_bgy', 'cet_bkr', 'cet_bgyw', 'cet_bky', 'cet_kbc', 'cet_coolwarm',
'cet_blues', 'cet_gwv', 'cet_bmw', 'cet_bjy', 'cet_bmy', 'cet_bwy', 'cet_kgy',
'cet_cwr', 'cet_gray', 'cet_dimgray', 'cet_fire', 'kb', 'cet_kg', 'cet_kr',
'cet_colorwheel', 'cet_isolium', 'cet_rainbow', 'cet_bgy_r', 'cet_bkr_r',
'cet_bgyw_r', 'cet_bky_r', 'cet_kbc_r', 'cet_coolwarm_r', 'cet_blues_r',
'cet_gwv_r', 'cet_bmw_r', 'cet_bjy_r', 'cet_bmy_r', 'cet_bwy_r', 'cet_kgy_r',
'cet_cwr_r', 'cet_gray_r', 'cet_dimgray_r', 'cet_fire_r', 'kb_r', 'cet_kg_r',
'cet_kr_r', 'cet_colorwheel_r', 'cet_isolium_r', 'cet_rainbow_r', 'jet'],
key=str.casefold), value='jet')
Defining the plotting functions
This function is the same as the one we defined for the simple dashboard above but it allows for the different variables defined in the panel widgets to be interactively chosen…
def plot(var=None, base_map=None, cmap='jet'):
base_map = base_map or base_map_select.value
var = var or var_select.value
label = f'{ds_bio[var].long_name}: {ds_bio[var].units}'
mesh = ds_bio[var].hvplot.quadmesh(x='longitude', y='latitude', rasterize=True, title=label,
width=600, height=600, crs=ccrs.PlateCarree(),
groupby=list(ds_bio[var].dims[:-2]),
cmap=cmap)
mesh = mesh.redim.default(**{d: ds_bio[d].values.max() for d in ds_bio[var].dims[:-2]})
overlay = (base_map * mesh.opts(alpha=0.9)).opts(active_tools=['wheel_zoom', 'pan'])
widgets = {dim: pn.widgets.Select for dim in ds_bio[var].dims[:-2]}
return pn.pane.HoloViews(overlay).layout #, widgets=widgets).layout
Widgets value selection functions:
def on_var_select(event):
var = event.obj.value
dashboard[-1] = plot(var=var)
def on_base_map_select(event):
base_map = event.obj.value
dashboard[-1] = plot(base_map=base_map)
def on_color_select(event):
cmap = event.obj.value
dashboard[-1] = plot(cmap=cmap)
var_select.param.watch(on_var_select, parameter_names=['value']);
base_map_select.param.watch(on_base_map_select, parameter_names=['value']);
color_select.param.watch(on_color_select, parameter_names=['value']);
Advanced dashboard
widget = pn.widgets.StaticText(name='', value='High-level dashboarding solution for interactive visualisation',
style={'font-size': "14px", 'font-style': "bold"})
selection_widget = pn.Row(var_select, color_select, base_map_select)
dashboard = pn.Column(widget, selection_widget, plot(var_select.value))
box = pn.WidgetBox('# eReefs App', dashboard)
box.servable()
As you can see, the resulting object is rendered in the notebook (above), and it’s usable as long as you have Python running on this code. You can also launch this app as a standalone server outside of the notebook, because we’ve marked the relevant object .servable(). That declaration means that if someone later runs this notebook as a server process (using panel serve --show ereefs_app.ipynb), your browser will open a separate window with the serveable object ready to explore or share, just like the screenshot at the top of this notebook.
#! panel serve --show --port 5009 ereefs_app.ipynb
Note
This web page was generated from a Jupyter notebook and not all interactivity will work on this website.
- 1
Signell & Pothina: Analysis and Visualization of Coastal Ocean Model Data in the Cloud, 2019.