The scientific Python stack
This material is adapted from the Scientific Programming course from Fabien Maussion.
Unlike Matlab, the set of Python tools used by scientists does not come from one single source. It is the result of a non-coordinated, chaotic and creative development process originating from a community of volunteers and professionals.
Here are some of the essential tools that every scientific Python programmer should know about. It is not representative or complete: it’s just a list of packages I happen to know about, and I surely missed many of them.
Python’s scientific ecosystem
The set of python scientific packages is sometimes referred to as the “scientific python ecosystem”. I didn’t find an official explanation for this name, but I guess that it has something to do with the fact that many packages rely on the others to build new features on top of them, like a natural ecosystem.
Jake Vanderplas made a great graphic in a 2015 presentation (the video of the presentation is also available here if you are interested), and I took the liberty to adapt it a little bit:
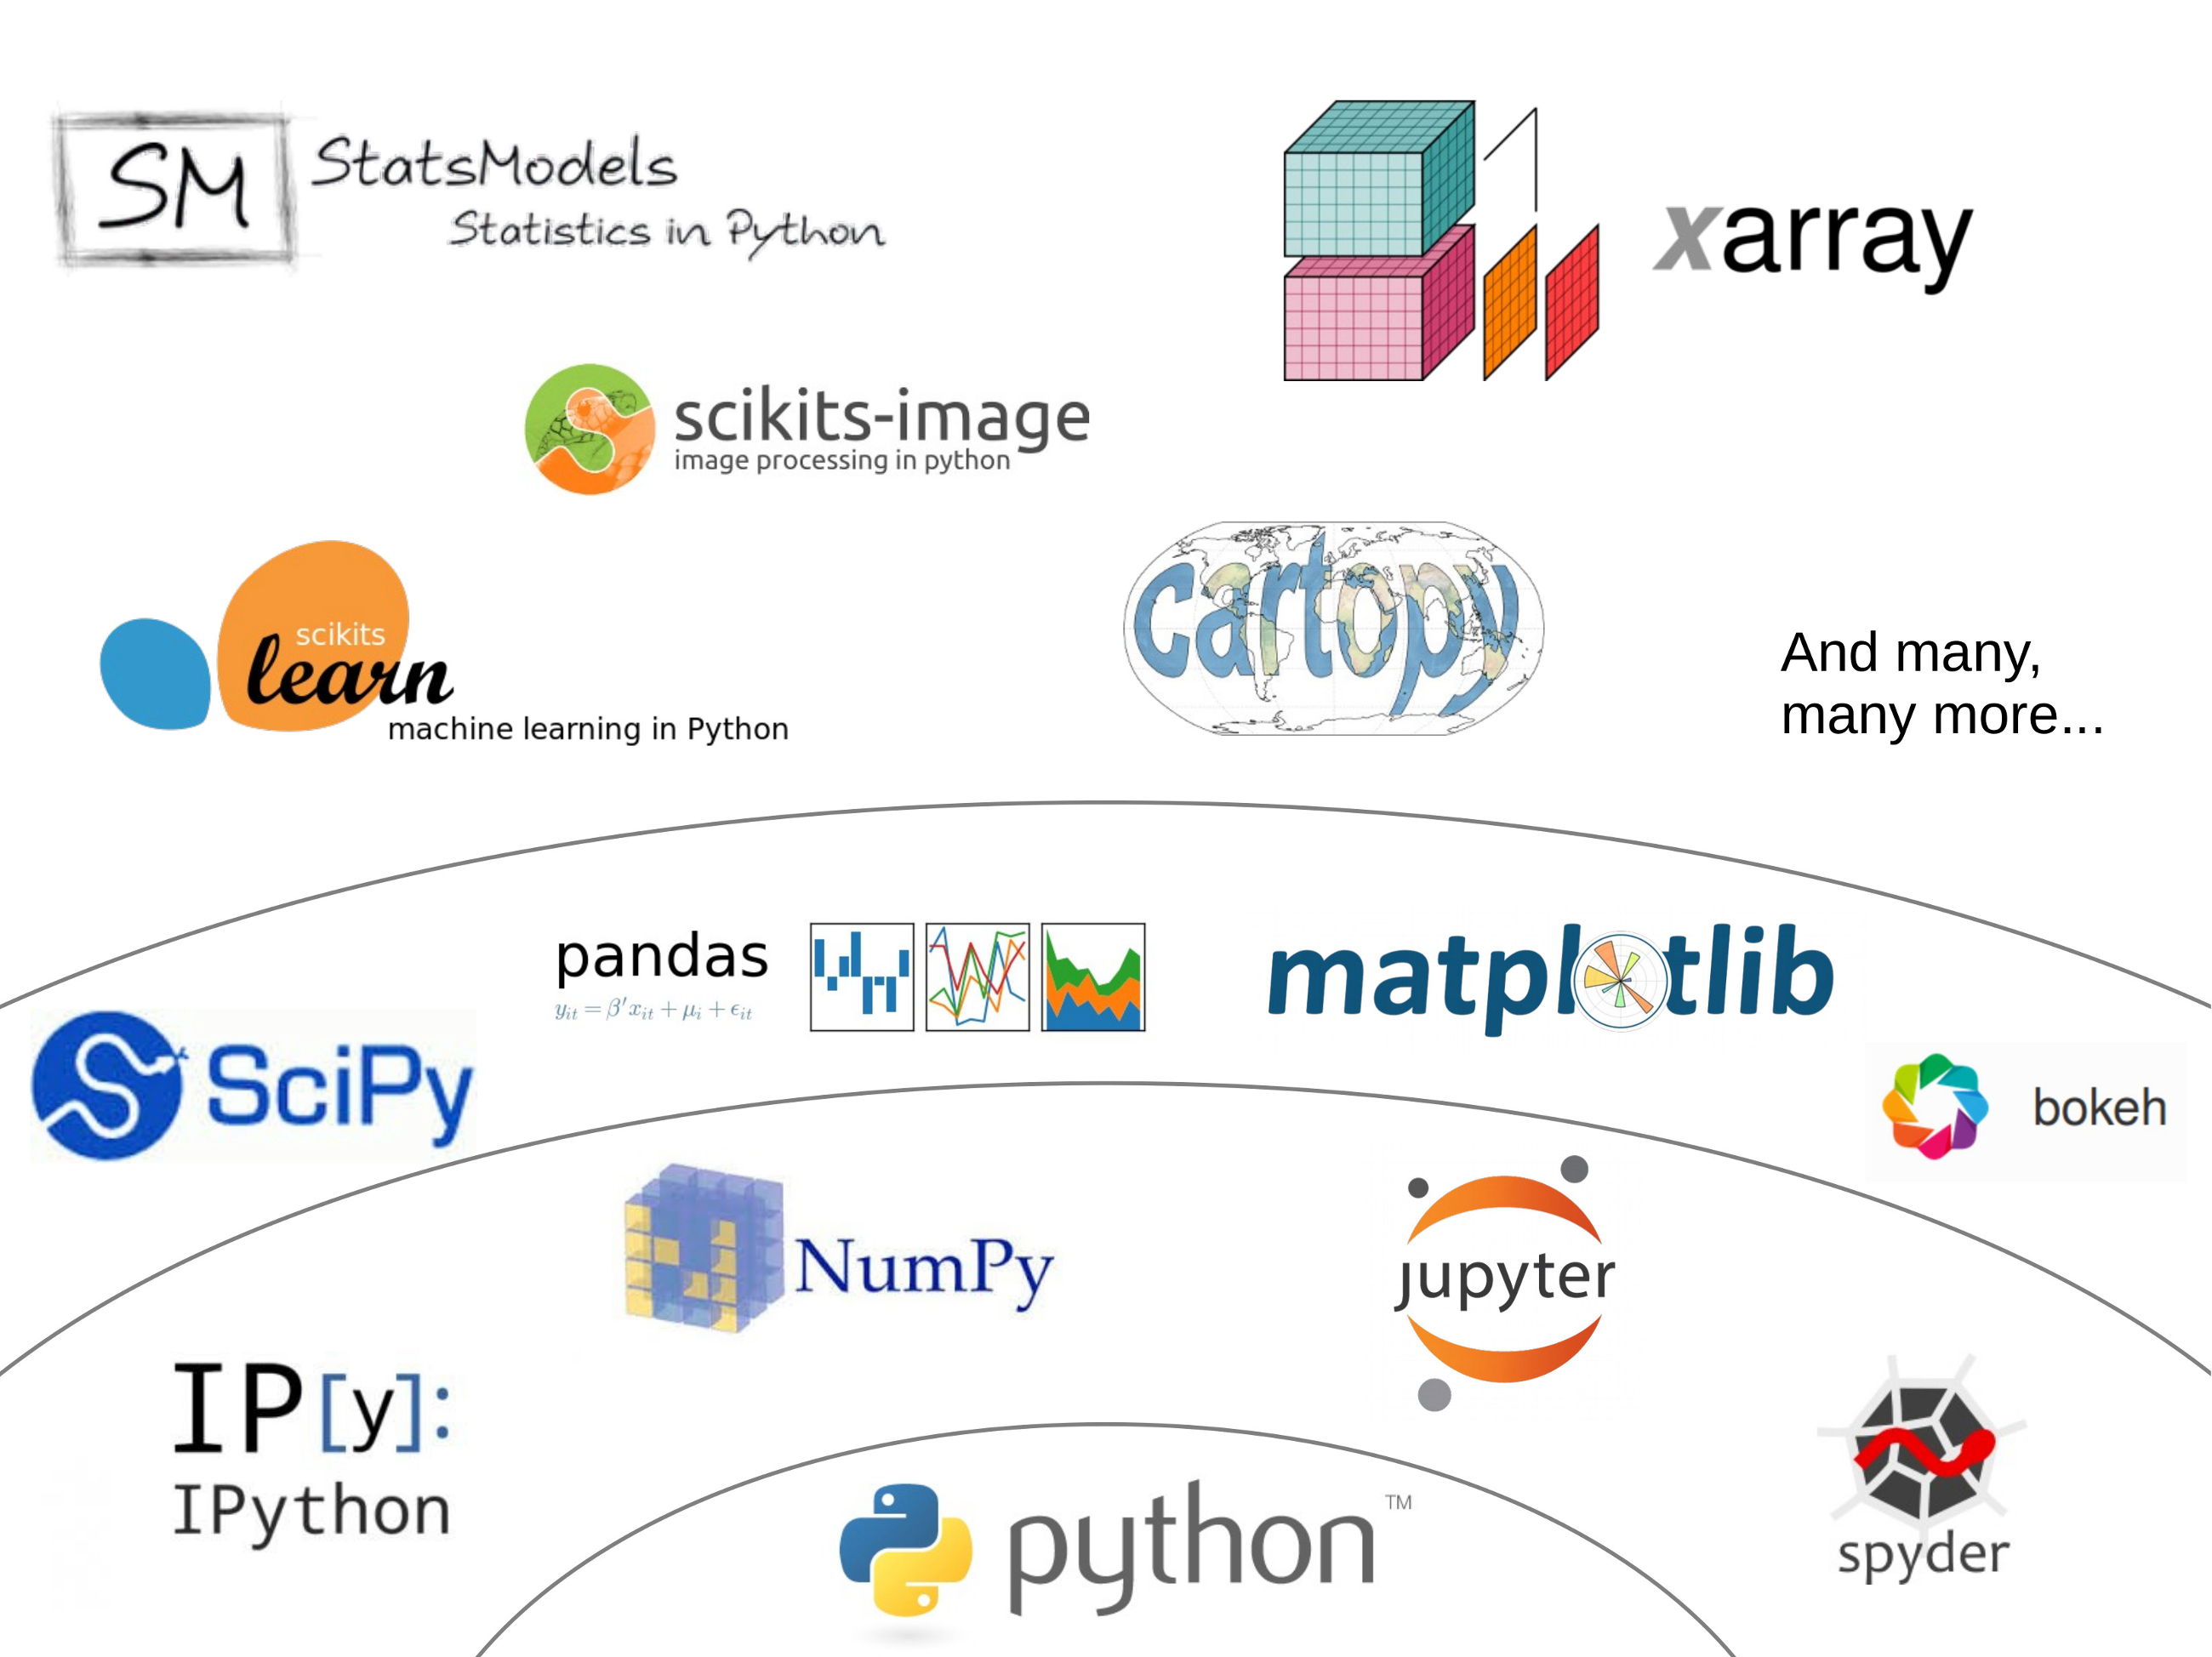
The core packages
numpy: documentation, code repository
scipy: documentation, code repository
matplotlib: documentation, code repository
Numpy provides the N-dimensional arrays necessary to do fast computations, and SciPy adds the fundamental scientific tools to it. SciPy is a very large package and covers many aspects of the scientific workflow. It is organized in submodules, all dedicated to a specific aspect of data processing. For example: scipy.integrate, scipy.optimize, or scipy.linalg. Matplotlib is the traditional package to make graphics in python.
Essential numpy “extensions”
There are two packages which I consider essential when it comes to data processing:
pandas provides data structures designed to make working with labeled data both easy and intuitive (documentation, code repository).
xarray extends pandas to N-dimensional arrays (documentation, code repository).
They both add a layer of abstraction to numpy arrays, giving “names” and “labels” to their dimensions and the data they contain. We will talk about them in the lecture, and most importantly, you will use both of them during the climate and cryosphere master lectures.