Quantifying coastal changes notes
Section intro
We will investigate nearshore to beach processes from wave run-up to beach profiles. We will also study different numerical approaches used to analyse shoreline changes.
Context
Small changes in the magnitude or direction of storm waves have the ability to profoundly disturb our coastlines by modifying beach stability and enhancing coastal erosion.
The coastal region is the most heavily urbanised land zone in the world and is regarded as a critical resource in view of its recreational, environmental and economic importance.
Note
Ocean coasts are affected by variations in mean sea level, extreme waves, storm surges and river flow through a range of physical processes.
Recent intensification in mean wave energy, extreme coastal wave energy and oceanic wind speeds, coupled with rising sea levels, suggest that coastal areas will be exposed to increasing hazards in coming decades.
It is therefore critical to observe and quantify changes along coastlines vulnerable to extreme as well as subtle changes in oceanographic forcing.
Nearshore and beach processes
In the video below, we will first look at the mechanisms that influence nearshore environments especially we will discuss the different temporal and spatial scales involved. Then, we will analyse which processes become dominant as waves propagate from offshore towards the coast. Finally, we will have a quick introduction to the existing models that can be used to simulate these processes.
Wave runup
Wave runup refers to the final part of a wave’s journey as it travels from offshore onto the beach. It is observable by anyone who goes to the beach and watches the edge of the water runup and rundown the beach. It is comprised of two components:
setup: the height of the time averaged superelevation of the mean water level above the Still Water Level (SWL)
swash: the height of the time varying fluctuation of the instantaneous water level about the setup elevation
Setup, swash and other components of Total Water Level (TWL) rise are shown in this handy figure below from Vitousek et al. (2017).
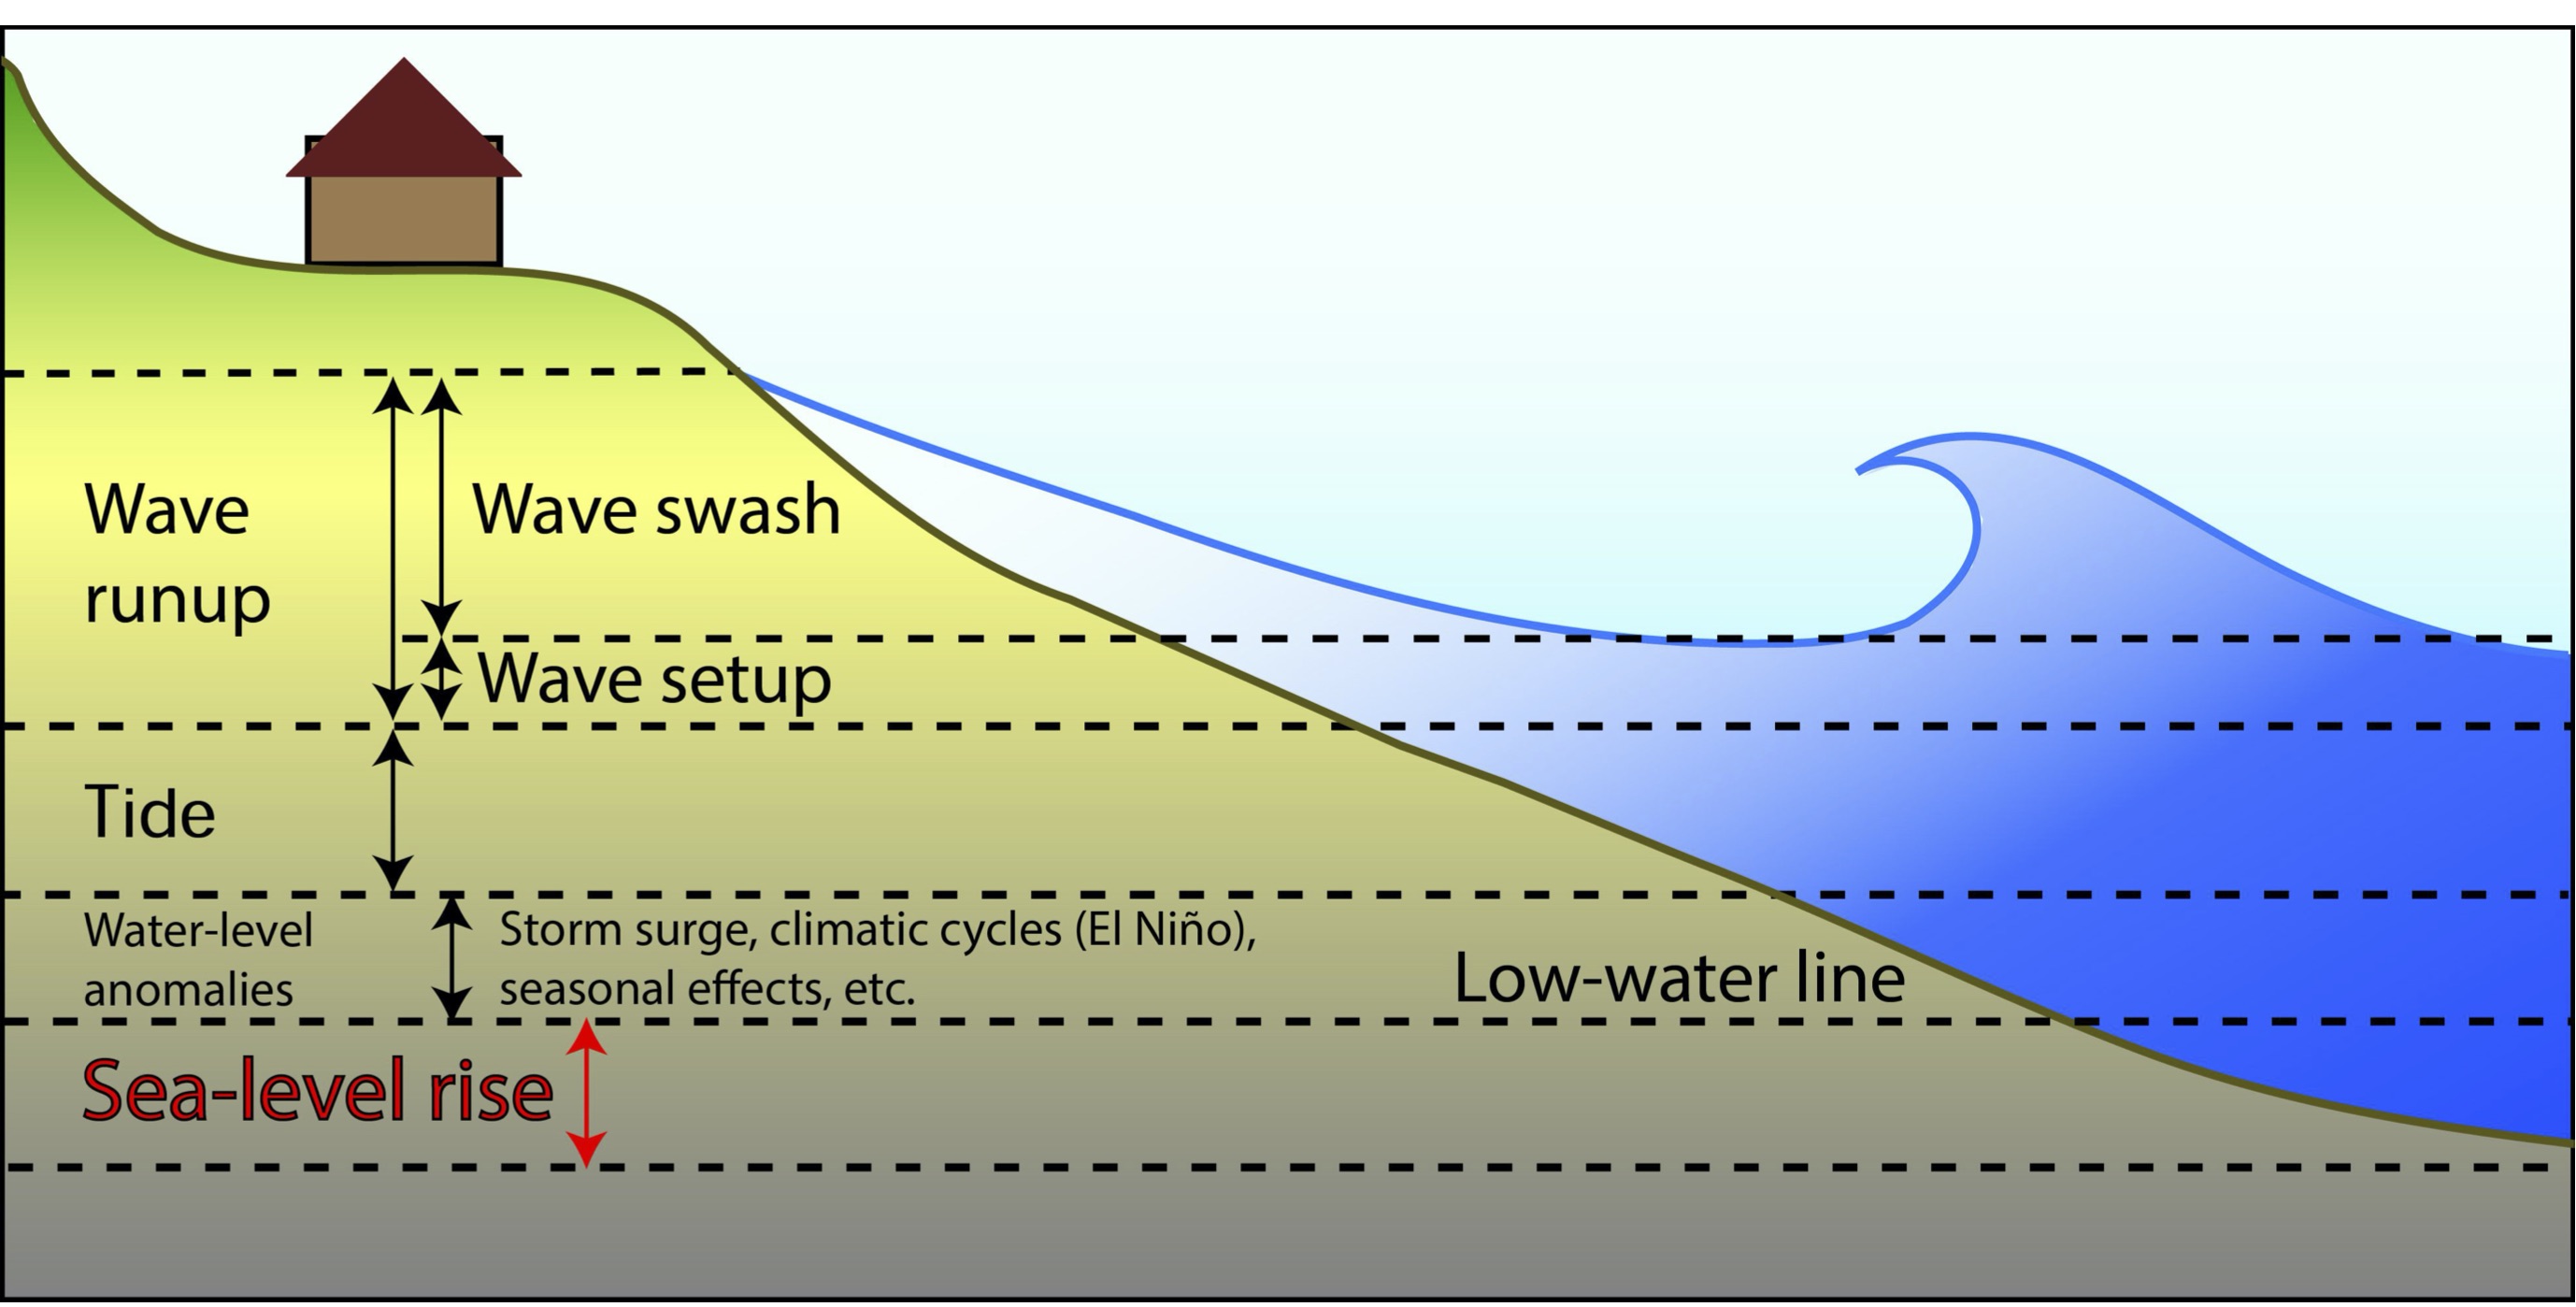
Fig. 16 The water-level components that contribute to coastal flooding from Vitousek et al. (2017).
Wave runup can contribute a significant portion of the increase in TWL in coastal storms causing erosion and inundation. For example, Stockdon et al. (2006) collated data from numerous experiments, some of which showed wave runup 2% excedence heights in excess of 3 m during some storms.
Given the impact such a large increase in TWL can have on coastlines, there has been much research conducted to try improve our understanding of wave runup processes.
Tip
Although there are many processes which can influence wave runup (such as nonlinear wave transformation, wave reflection, three-dimensional effects, porosity, roughness, permeability and groundwater), many attempts have been made to derive empirical relationships based on easily measurable parameters.
Typically, empirical wave runup models include:
\(H_{s}\): significant wave height
\(T_{p}\): peak wave length
\(\beta\): beach slope
py-wave-runup (here) is a Python package that implements different published wave runup empirical models based on \(H_{s}\), :\(T_{p}\), and \(\beta\).
Wave runup models from the py-wave-runup model
Using py-wave-runup , we will evaluate the accuracy of the Stockdon et al. (2006) runup model. To do this, we will use the compiled wave runup observations provided by Power et al (2018).
The Stockdon et al. (2006) wave runup model comprises of two relationships, one for dissipative beaches (i.e. Iribarren number \(\zeta < 0.3\)):
and a seperate relationship for intermediate and reflective beaches (i.e. Iribarren number \(\zeta > 0.3\)):

Jupyter Notebooks
First we will run the waverunup.ipynb to assess the 2 runup models.
Then we will evaluate wave runup observations against the Iribarren number with the following notebook: runupdataset.ipynb.
Beach profiles
Sandy coastlines typically comprise two key parts: a beach and dune.
Caution
The beach is the section of sandy coast that is mostly above water (depending upon tide) and actively influenced by waves, while dunes are elevated mounds/ridges of sand at the back of the beach.
The interface between the beach and dune is often characterised by a distinct change in ground slope (with the dune having a steeper slope than the beach). Dunes are particularly important along sandy coastlines because they provide a natural barrier to coastal hazards such as storm-induced waves and surge. The capacity of sandy dunes to provide coastal hazard protection depends in large part on their geometry.
Important
The location of the dune toe (the transition point between the beach and dune) is a key factor used in coastal erosion models and for assessing coastal vulnerability to hazards (Sallenger, 2000).
Domain experts are generally able to identify the location of the dune toe given a 2D beach profile. However, recent improvements in coastal monitoring technologies (such as optical, Lidar, and satellite remote sensing), have resulted in a significant increase in coastal topographic data, for which analysis by an expert is infeasible. As a result, there has been increased need for reliable and efficient algorithms for extracting important features such as dune toes from these large coastal datasets.
There are many different algorithms currently available for automatically detecting the dune toe on 2D cross-shore beach profiles:
Maximum curvature (Stockdon et al., 2007) - the dune toe is defined as the location of maximum slope change;
Relative relief (Wernette et al. 2016) - the dune toe is defined based on relative relief (the ratio of local morphology to computational scale);
Perpendicular distance - the dune toe is defined as the point of maximum perpendicular distance from the straight line drawn between the dune crest and shoreline; and,
Machine learning (ML) using Random Forest classification.
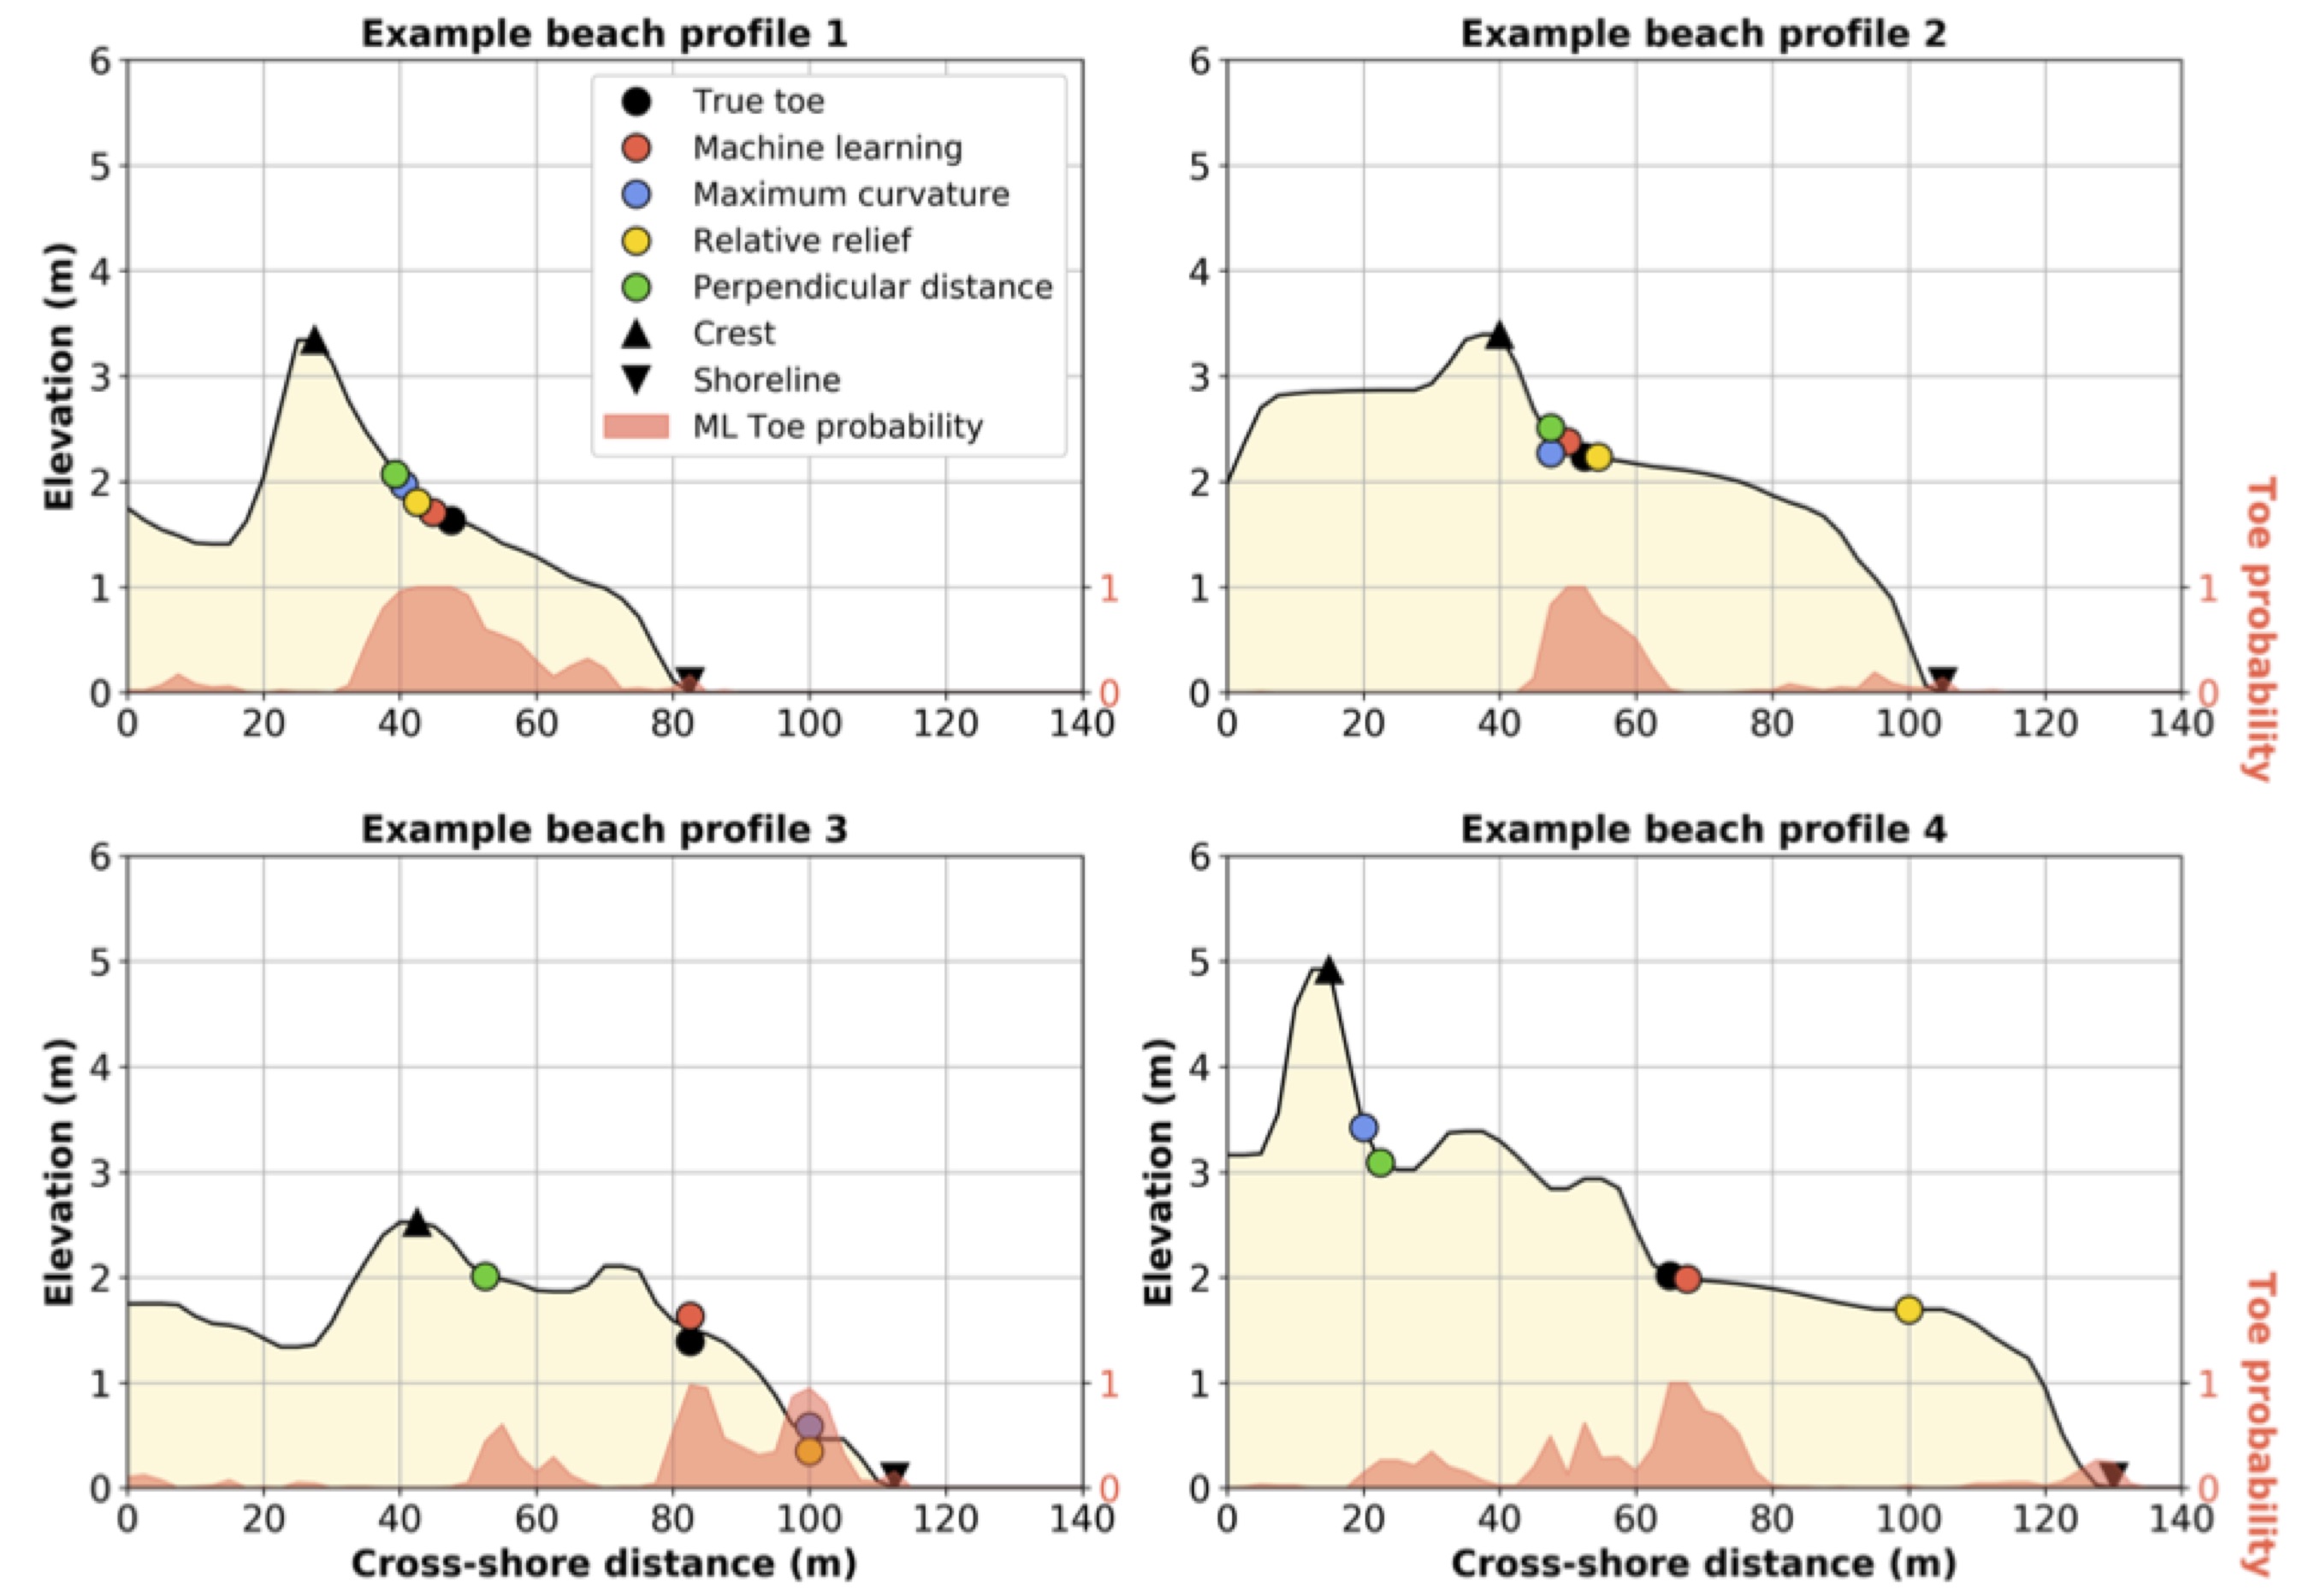
Fig. 17 Example applications of pybeach.
Locating the dune toe using Machine Learning
As shown in the figure above using pybeach code from Beuzen the performance of these algorithms in extracting dune toe locations on beach profiles varies significantly. While experts can generally identify the dune toe on a beach profile, it is difficult to develop an algorithm that can consistently and reliably define the dune toe for the large variety of beach profile shapes encountered in nature.
In such cases, the use of machine learning (ML) can help improving toe detection. It consists in feeding the ML algorithm with existing dataset. In pybeach three pre-trained ML models are provided:
a barrier-island model. This model was developed using 1046 pre- and post- “Hurricane Ivan” airborne LIDAR profiles from Santa-Rosa Island Florida (this data was collected in 2004);
a wave-embayed model. This model was developed using 1768 pre- and post- “June 2016 storm” airborne LIDAR profiles from the wave-dominated, embayed southeast Australian coastline (this data was collected in 2016).
a mixed model. Developed using a combination of the two above datasets.
For each dataset described above, the true location of the dune toe on each individual profile transect was manually identified and quality checked by multiple experts and verified using satellite imagery, digital elevation models and/or in-situ observations where available. This resulted in the best possible data to facilitate the creation of the ML models in pybeach.
Using pybeach.ipynb notebook, you will have a look at how pybeach could be used to locate the dune toe on cross-shore beach profile transects.